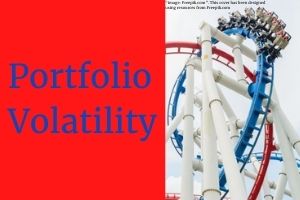
Portfolio volatility measures how much and how often your investments change in value. The change can be positive or negative. By looking at the historic volatility of a portfolio in Excel, an investor can decide how comfortable they are with the potential changes in value.
Everybody likes volatility. As long as the sudden, drastic, changes in value move in their favor.
Maybe, when your portfolio has shot up in value, you’ve thought to yourself – “I’m going to give most of this back.” Or, “This won’t last.”
But, you’ve probably never thought – “This sucks. I wish my portfolio had dropped in value instead.” If you have, it’s only because you had a lot of cash to invest and still had a ton of confidence in your investment choices.
Anyhow, volatility happens both ways. Up and down. The more you can come to terms with that, the less likely you are to make a rash investing decision that you’ll regret.
This spreadsheet was designed to look at the historical volatility of your portfolio and to analyze it in plain terms. You can even amplify the historic volatility to make sure you’re ready for whatever the market might throw at you.
The spreadsheet is free to download. A good price for peace of mind.
Download the Portfolio Volatility Excel Spreadsheet
Complete the form below and click Submit.
A link to the Google Sheet will be emailed to you.
Once you’re in the spreadsheet, click on File > Make a copy to edit. I’ll no longer be responding to “Requests for access.”
A unique look at calculating portfolio volatility in Excel
As I said above, this spreadsheet will help you analyze your portfolio’s historical volatility. It will also allow you to play “what if” by increasing the severity of the historical volatility. In fact, it doesn’t even have to be your portfolio. You can use this tool on any individual, or group of investments, that you are interested in.
Most other historical volatility spreadsheets take a more “academic” viewpoint on volatility. Measuring things such as standard deviation and variance. This is all fine and good. However, I wanted to offer an alternative perspective.
The point of this spreadsheet. is to decide what kind of stomach you have for the changes in value you might expect from this portfolio. Knowing that, you can move forward confidently and not get shook up when drastic changes in value take place.
Obviously, price history provides the groundwork for measuring historical portfolio volatility in a spreadsheet.
What actually happened isn’t the only scenario that could have happened, though. Plus, no investment analysis is complete without taking margin/leverage into consideration. This spreadsheet will do both.
When everything is brought together, this workbook will tell you what the most volatile days looked like. Both from a dollar and percentage standpoint. Plus, it will tell you how often the volatility was more than a threshold of your choosing.
Yes, the title says “Excel.” However, my screenshots will come from Google Sheets as a matter of preference. Every formula should be the same in Excel.
The charting will be a little different. But, should be easy enough to figure out.
If you opt to use the GOOGLEFINANCE functionality for historical pricing, you’ll have to use Google Sheets, of course. In my example, I opted to use the Adjusted Close from Yahoo! Finance. So, again, you should be able to copy what I’ve done in Excel easily.
As far as formatting goes, that’s a matter of preference. For all of my spreadsheets, I like to leave the variables in white cells. All of my field and row names, along with formulas, will typically be shaded. I feel this makes worksheets easier to navigate and understand.
Finally, rather than walking you through each formula in each worksheet, I’ll just show screenshots with all of the formulas showing. This should make it easier to copy – if that’s what you’d like to do.
The bigger images can be clicked on and an enlarged version should open in a new tab. If that image isn’t large enough, use Ctrl + “+” (the plus sign) to zoom.
All that said, let’s get into it…
Price history
The Price History sheet doesn’t have much in the way of formulas. Its main purpose is to provide a space to paste historic closing prices.
This is what the finished Price History sheet should, more or less, look like:
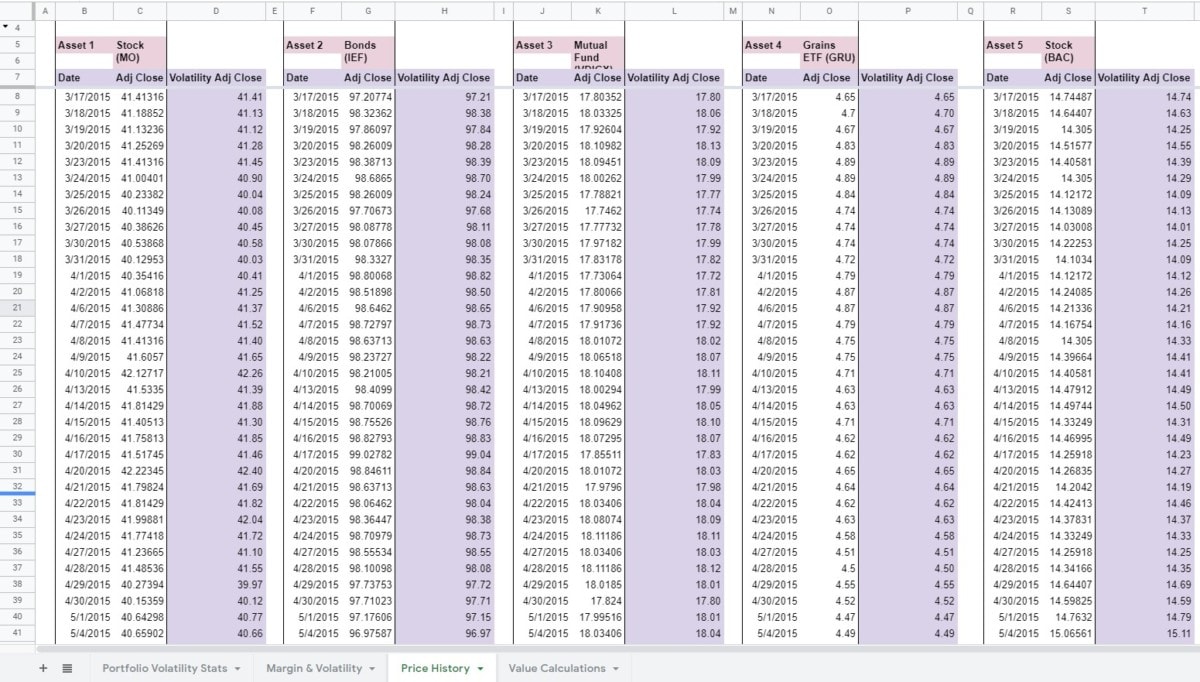
The top 3 rows are hidden, you might notice. There are no formulas in these rows. They are simply hidden to keep the Dates in the Price History worksheet on the same row as the Margin & Volatility worksheet.
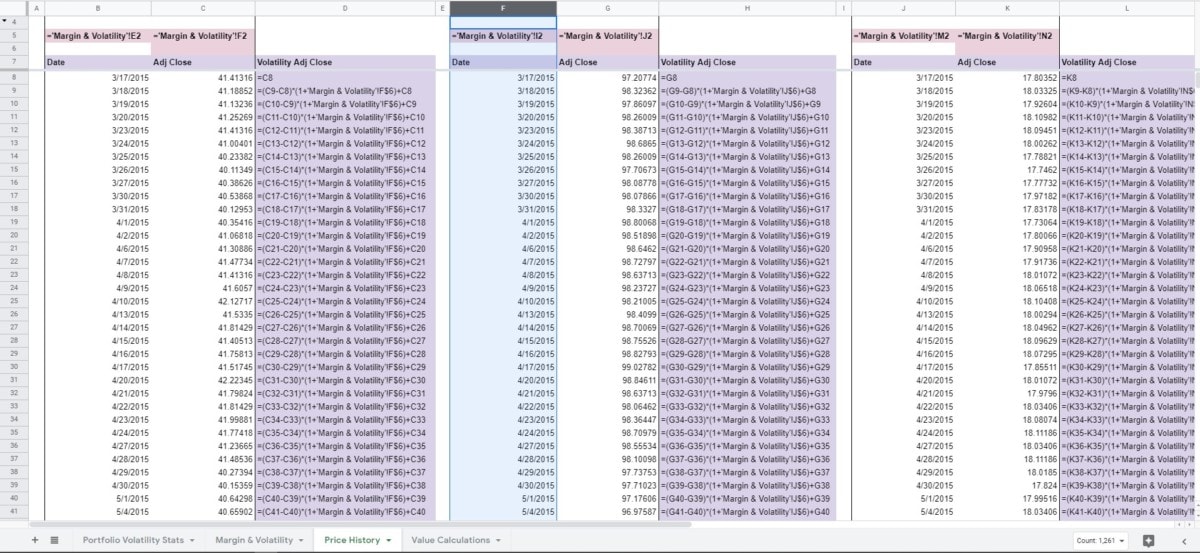
Below is a look at the formulas in the column. As will be the case throughout this post, I could only include a few of the columns. Hopefully, you can recognize the pattern I used to determine what the rest should be. If you need help, download the spreadsheet by completing the form above.
Also, keep in mind that the formulas may go on for many, many rows. The more history you have, the better your portfolio volatility analysis should be.
Of course, it’s up to the user to drop in the Date and Adj Close information. I usually get mine from Yahoo! Finance. If you’re savvy enough, you can use the GOOGLEFINANCE function to automate the task. Just know that GOOGLEFINANCE price history won’t be adjusted for dividends.
The formulas in the heading are pretty straightforward, they just pull from the Margin & Volatility sheet.
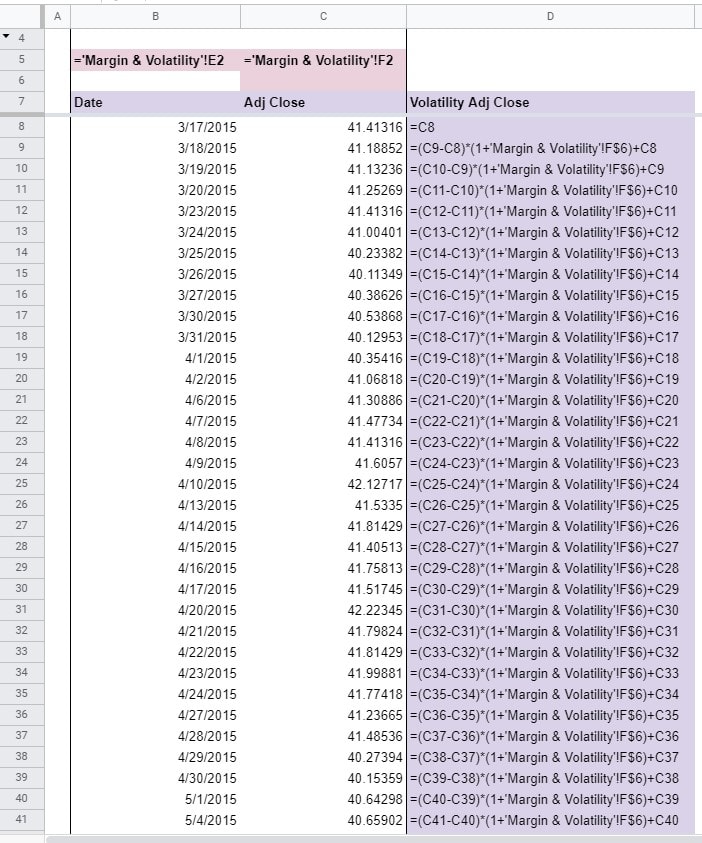
It’s the Volatility Adj Close field that’s of special interest here. This formula looks at the dollar change from the previous day and magnifies it by the percentage specified in the Extra volatility cell (Margin & Volatility spreadsheet) for that particular Asset.
For example, if a particular Asset had 10% Extra volatility and its Adj Close was +$1.00 from the previous day, then the Volatility Adj Close would be +$1.10.
Below, is a closer look at the Volatility Adj Close formulas. Keep in mind that the formula will change to match its counterpart on the Margin & Volatility spreadsheet. Also, again, that the formula will continue down the sheet as far as it needs to reflect the Extra volatility for all of the price history
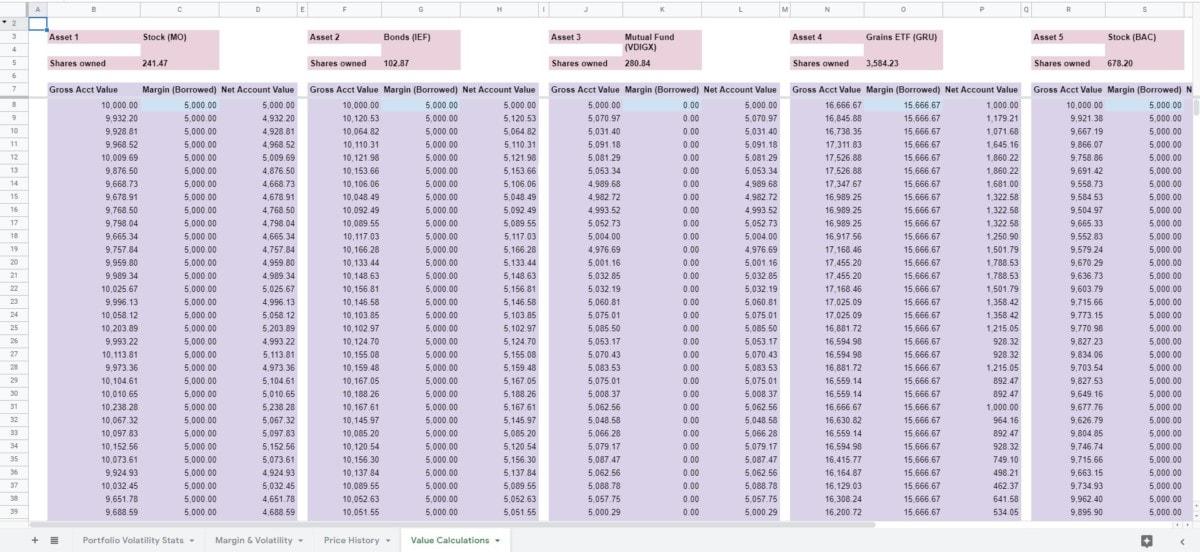
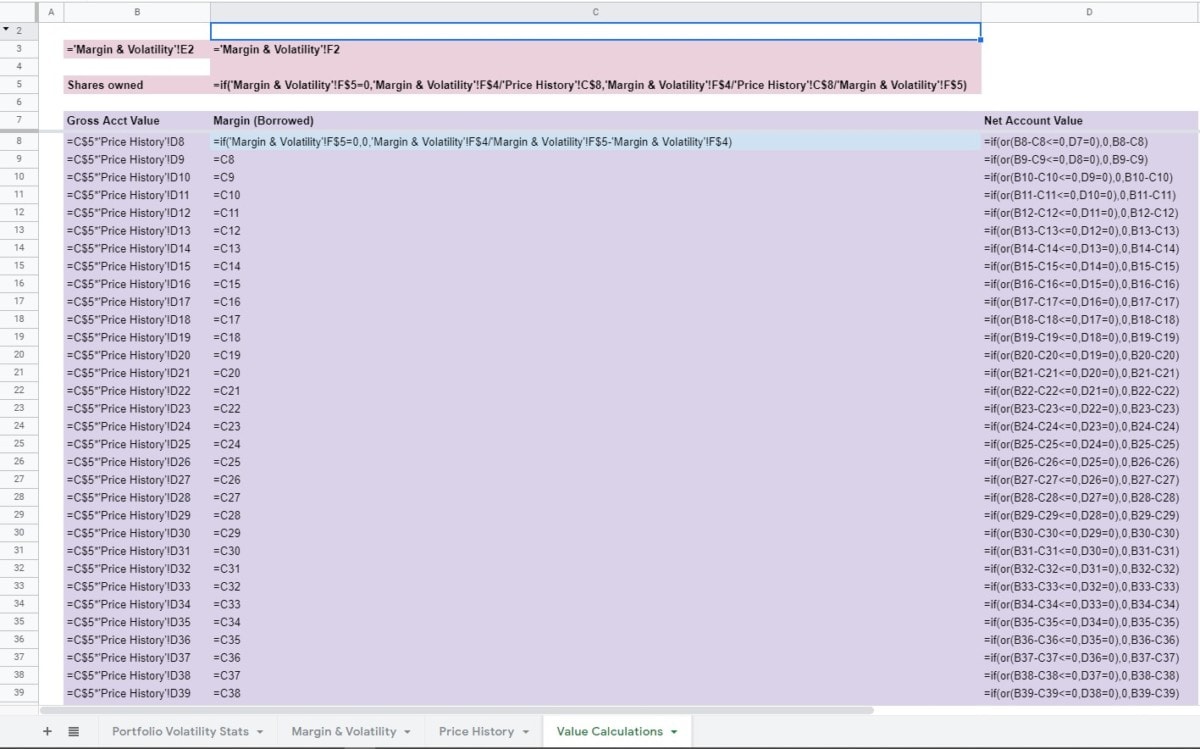
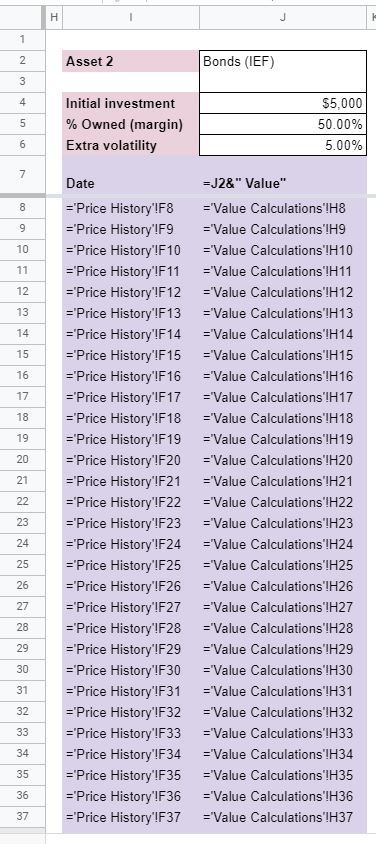
Value calculations
This spreadsheet only exists to perform background calculations. There are no user inputs on this worksheet. In fact, I ordinarily keep it hidden.
This is what the finished spreadsheet should look like:
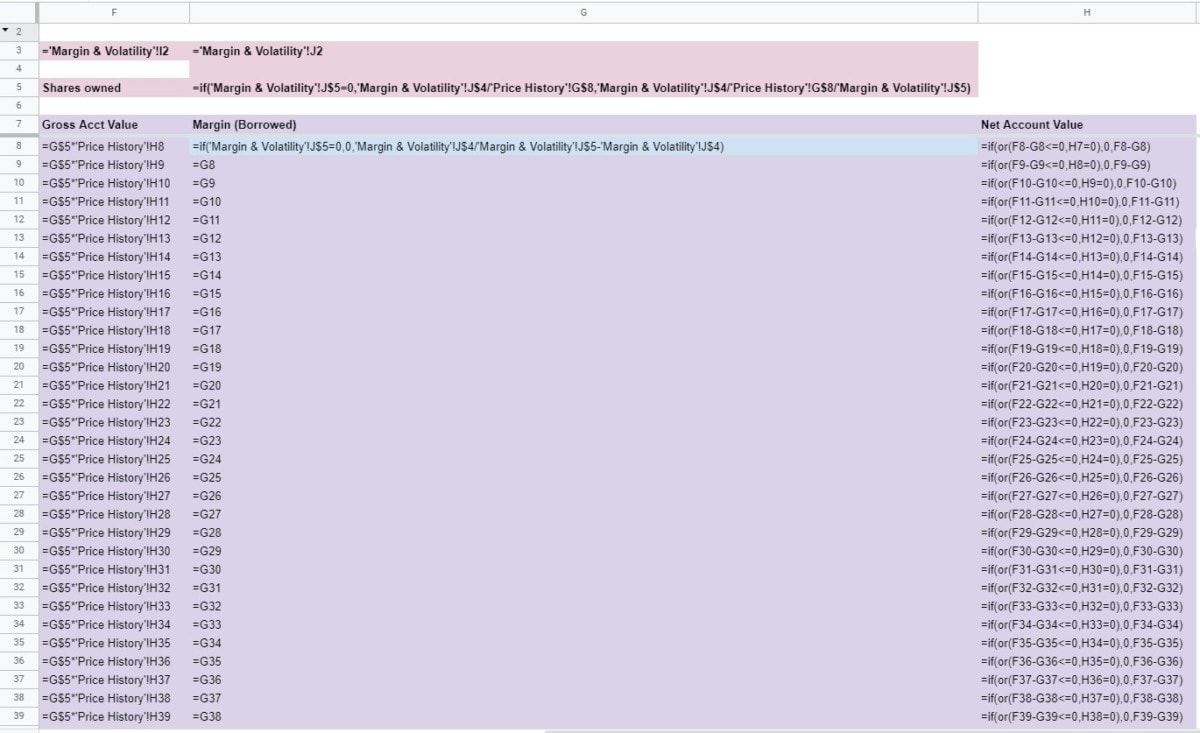
And, here is what the formulas look like for Asset 1. Some of the formulas are so big, I couldn’t fit them all on a single screenshot.
Here are the formulas for Asset 2. Hopefully, you see the pattern here and understand that it will continue for the rest of the Assets you include in this Portfolio Volatility workbook.
The header information pulls in the name of the Asset and calculates the Shares owned. Fractional shares are calculated since cash isn’t taken into consideration in this spreadsheet. If you want to get exact, you can tweak the first row in the Adj Close column in the Price History worksheet. The Shares owned field will also take into account the % Owned (margin) amount on the Margin & Volatility spreadsheet.
The formulas in the columns below that also revolve around margin. It is here that a Net Account Value is calculated based on the change in the value of what’s owned (Gross Acct Value) vs what’s owed (Margin(Borrowed)).
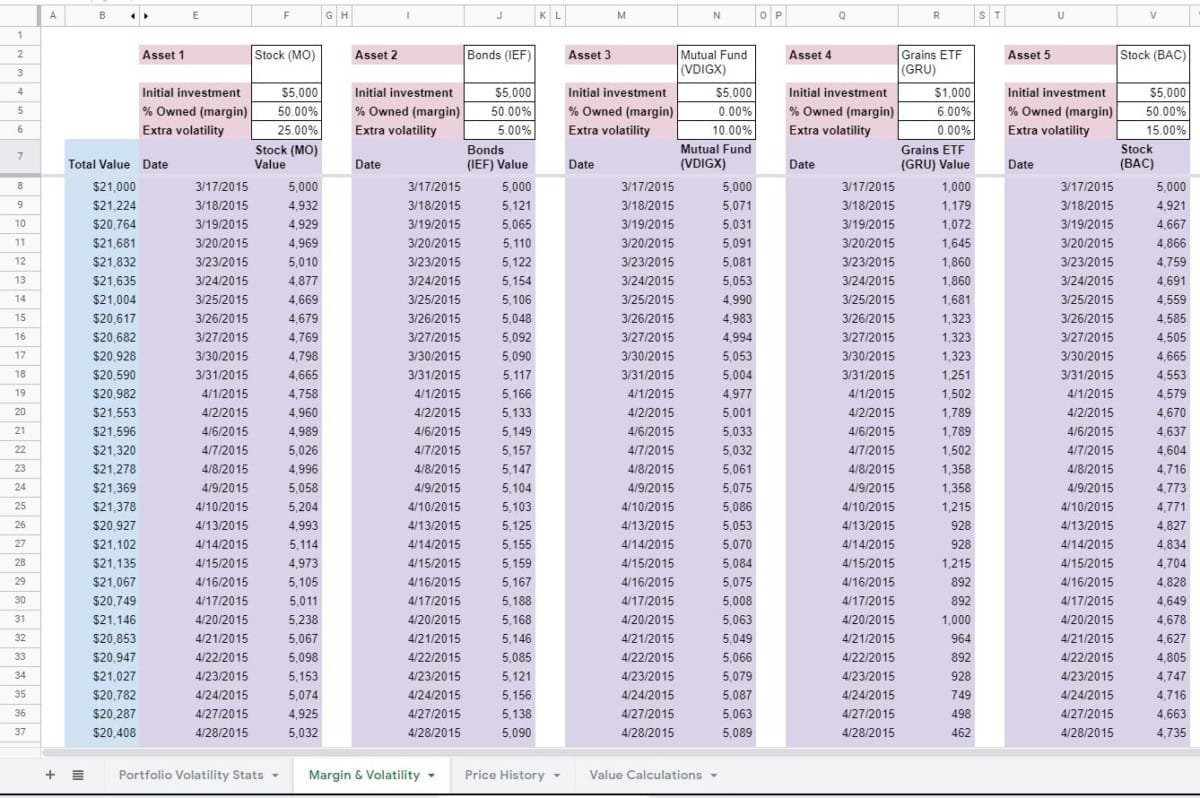
Margin & volatility
The only user inputs on the Margin & Volatility spreadsheet are the Asset’s name/ticker, the Initial investment, the % Owned (margin), and Extra volatility.
Below, is, roughly, what the finished product should look like. Note that columns C and D are hidden.
Here are the formulas for this spreadsheet:
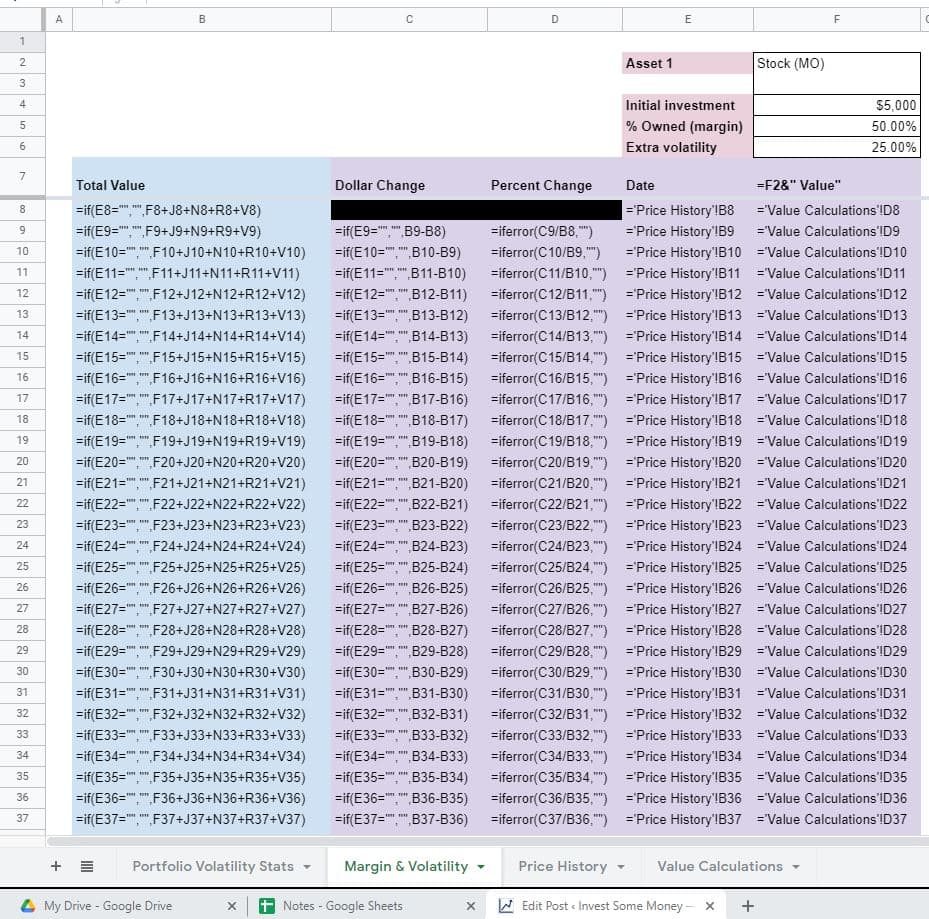
In the screenshot above, you’ll see that the Dollar Change and Percent Change columns are showing. These are pretty self-explanatory and are calculated for use on the Portfolio Volatility Stats spreadsheet.
Total Value, of course, sums that value of each Asset. Which, in turn, pull their values from the results on the Value Calculations worksheet.
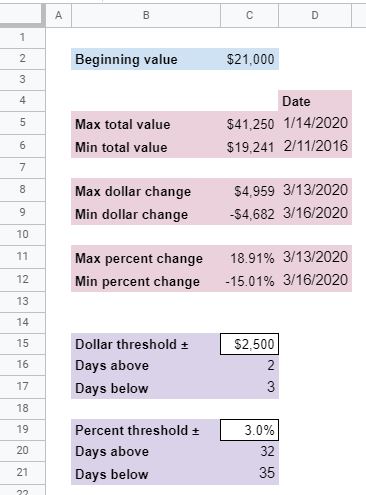
Portfolio volatility statistics
It’s on this spreadsheet that all of the information input and calculated on the others comes together.
There are two inputs for the user – Dollar and Percent threshold ±. These inputs allow the user to see how many Days above and below their portfolio would exceed a certain level of volatility.
This is what the worksheet should roughly look like when you’re finished:
Here are the formulas that make it up.
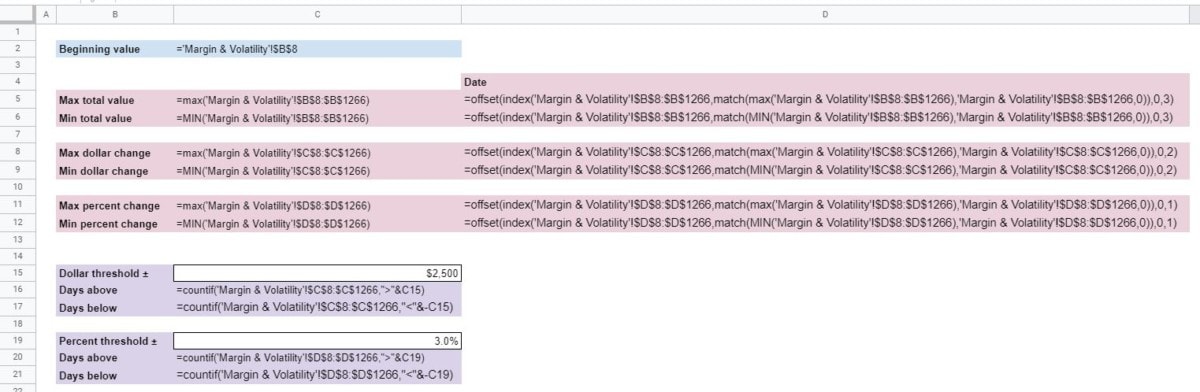
These formulas, though not simple, might be self-explanatory. Aside from those related to the user input, mentioned above, the rest look at the extremes in volatility for your portfolio over the given time period.
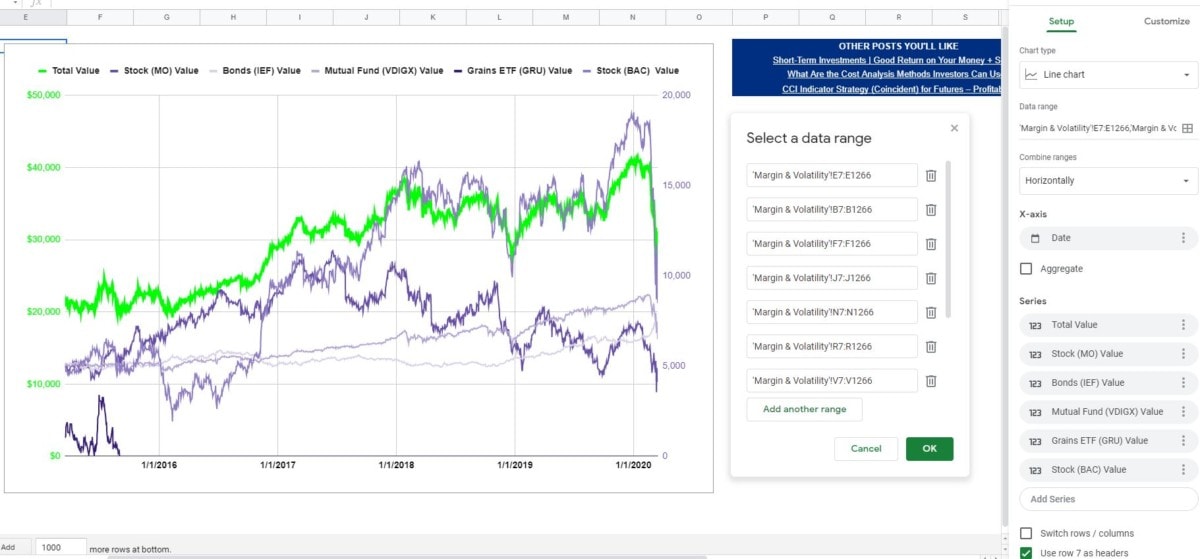
You may also want to include a chart, as I did in my example. All of the data for that chart will come from the Margin & Volatility spreadsheet. Here’s a look at the chart setup if you’d like to duplicate it:
Why you shouldn’t worry about historical (and future) portfolio volatility
If you’re younger, you have a longer investing timeline. (Theoretically) volatility shouldn’t spook you as much. Though, personally, I think your personality will have as much to do with your fear of portfolio volatility as your age. But, the point still stands – if you’re younger, you do have a greater likelihood of making any losses up.
Also, if you’re comfortable with your investing strategy, then big swings in value shouldn’t hurt as much. In fact, you could look at a huge dip in value as an opportunity to buy more of an asset that you “have to” own. Something you love has gone on sale…
Volatility in your portfolio is feedback. If you don’t care for the feedback you’re getting, then you know you need to do something different. Assuming that you don’t have to sell at the bottom means that you can implement this feedback and end up in a better position in the future.