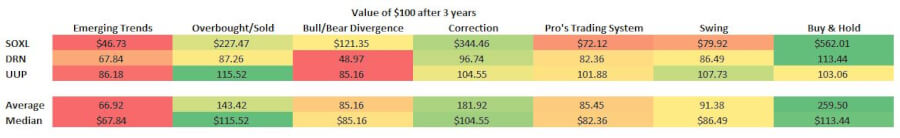
- Without the use of leverage and stops, nothing beat buying & holding.
- The CCI Correction and Overbought & Oversold indicator strategies showed some promise.
- The Emerging Trends, Bullish & Bearish Divergence, Pro’s Trading System, and CCI swing strategies did not.
A Big List of Commodity Channel Index (CCI) Indicator Strategies
While there’s only one CCI equation, there are many ways to interpret the information that equation provides. It’s kind of crazy how one number can mean so many different things.
Maybe you’re familiar with the CCI indicator or, maybe you’re brand new to it. It’s certainly been discussed in-depth on numerous other websites. You’ll find the ability to add the CCI indicator to about any site that has stock charts.
It’s one thing to know how to calculate the CCI. It’s another to understand what that indicator is trying to tell us. And, it’s still another to take a stab at determining the best way to use it.
So whether you’ve used the CCI or not, it doesn’t really matter. What I’m trying to shine the tiniest little bit of light on, is which strategy makes the most sense when it comes to trading.
How will I do that?
I looked at three different 3x leveraged ETFs over the past three years. With this historical information, I backtested six different trading strategies to see how they performed.
Each indicator strategy model began with “$100.” Percentage gains for trades were added to that. Losses were taken away.
Now, if you’ve read some of my other posts on the CCI indicator you know that different trading strategies can perform differently if the settings are different. To make this an apples-to-apples comparison, of course, I had to use consistent settings throughout. A 14-day CCI with an upper limit of +100 and lower limit of -100 was used as the foundation for all of these indicator strategies.
For those trading strategies that required a weekly CCI, a 14-week look-back was used.
Also, some of these trading strategies “require” the use of stops. Stops might be prudent, or downright necessary for some of the strategies. But, since there were no consistent criteria for implementing a stop, I chose to leave them off completely. This way, the trading strategy had to stand on its own merit. The use of stops will be examined in-depth sometime in the future.
In these simulations, positions were allowed to go both long and short. This was done to allow these CCI indicator strategies the opportunity to demonstrate their ability to take advantage of down markets as well as up markets.
Finally, a buy & hold return was calculated to serve as the benchmark for the indicator strategy returns.
The six trading strategies
Theoretically, an infinite number of trading strategies could be conceived for the CCI indicator. I tried to keep my focus on those that I felt were most commonly referenced on the web (or at least were close enough). Each trading strategy will be dissected in greater detail later in the post. But here’s a list of their name (or, if they didn’t have one, the name I’m giving them):
- Emerging Trends
- Overbought & Oversold
- Bullish & Bearish Divergence
- CCI Correction
- Pro’s CCI Trading System
- CCI Swing
Those six CCI trading strategies were tested against three 3x leveraged ETFs.
Why use ETFs?
My thinking was as follows: I figured that ETFs, even 3x leveraged ones, wouldn’t be as susceptible to irrationally exuberant gains or losses as a random stock might be. I wanted something that would fluctuate in value but not gain or lose value exponentially over the three-year period. Additionally, I chose to use 3x leveraged ETFs because I figured they would have enough volatility for there to be adequate buy and sell opportunities. In other words, I was looking for something with just enough volatility.
I tried to pick ETFs over an array of asset classes. For instance, the first ETF is SOXL – a bullish semiconductor ETF. The next is DRN – a bullish real estate ETF. The final is UUP – a bullish US Dollar ETF. Obviously, this is a small sample of all the available investments that an individual could make. But, I had to keep it within reason and it’s my hope that these three ETFs will serve as a good starting point.
Why use spreadsheets for backtesting?
I should hope that the answer is obvious. But in case it’s not – it’s because I want to know how well a particular technical indicator and or trading strategy works. Anybody can whip out a chart as an example and point to when you should have bought and when you should have sold in retrospect. Simply saying “buy low” and “sell high” doesn’t tell you about the magnitude or the timing of gains or losses. To me, that information is critical to deciding if a technical indicator is worthwhile.
That’s not to say that backtesting and spreadsheets are not susceptible to a goodness-of-fit bias. They can easily be susceptible. But, I think it’s a step in the right direction. Keep in mind that nothing I write on this website is a guarantee of investment returns.
All I can say for certain is that a certain investment performed a certain way over a certain period when using a certain strategy. The future’s unknown. That’s it. Nothing more, nothing less.
Commissions, taxes, margin, and other stuff
This analysis was not as detailed as some of my previous ones. In those models, I attempt to replicate as realistic of a trading scenario as possible. Here, though, no consideration was given to the effects of commissions, taxes, margin, or anything else of that nature. This was, by design, a simplistic analysis to narrow the field and to hopefully provide some insight on what the best performing CCI indicator strategies are.
At the bottom of the post, all of the information I found is brought together including charts of performance and a table that summarizes the returns of each strategy for each security.
So if you currently use the CCI indicator in your trading – perhaps you’d be interested to know if there’s a potentially better system out there? If you don’t use the CCI maybe you’re curious about how it might help you make more profitable trades?
1. Emerging Trends
Here’s the inspiration for this indicator strategy. It’s the same one I’ve linked to in previous CCI posts.
You’ll see it said, if you do any research on the matter, that the CCI is only meant to complement other indicators, not be used on its own. My rationale has always been – if it can’t stand on its own, then it isn’t going to do any damn good when paired with another technical indicator such as RSI or Williams %R.
Nevertheless, I decided to include it because it’s the most simplistic CCI indicator strategy there is. Buy signals are triggered when the 14 day CCI is above +100 and sell signals when it’s below -100. There is never any period in which you sit out and hold.
Worst performer
I often feel that simpler is better. This indicator strategy is easy to use and understand. But that’s about all that can be said for it.
The performance was pretty dismal for the Emerging Trends indicator across all three ETFs. It was only with DRN that this indicator strategy showed any hope of a gain over the three-year look-back period. When all is said and done, after three years, the average value of your $100, using the Emerging Trends indicator strategy was only $66.92.
There’s not much promise here. Let’s move on to the next one.
2. Overbought & Oversold
The inspiration for this indicator strategy can be found here. It’s the same link as was posted for the Emerging Trends indicator strategy.
Using the CCI to estimate when a security is overbought or oversold is a bit more of a sophisticated analysis than using it to isolate Emerging Trends. Though, not so sophisticated that you would ever be on the sidelines holding. No matter what, you’re going to be long or short at all times.
An asset is considered overbought when the 14-day CCI rises above +100 and then falls back below. It’s at that point that a sell signal is generated. On the flip side, when the 14-day CCI falls below -100, and then rises back above, a buy signal is generated.
Shows some potential
The Overbought & Oversold indicator strategy is almost the inverse of the Emerging Trends strategy. If you read the previous section you might have guessed what that means in terms of performance.
On average, your $100 would have turned into $143.42 at the end of three years using the Overbought & Oversold CCI indicator strategy. A pretty good return on average, but, in reality, the majority of that is owed to the performance of SOXL. DRN actually returned a loss ($87.26) over the three-year period. UUP was only up slightly ($115.52).
This is a simple to use and understand indicator strategy which seems to have the potential to deliver returns that are better than the Emerging Trends strategy. Looking at the charts, the more volatile the ETF, the better the Overbought & Oversold indicator strategy seemed to perform.
Like the Emerging Trends indicator strategy, however, the Overbought & Oversold strategy underperformed buying & holding.
3. Bullish & Bearish Divergence
Link to the inspiration for this CCI indicator strategy (surprise! It’s the same as the previous two!).
Here again, we’re going to step up the sophistication a bit. The Bullish & Bearish Divergence indicator strategy moves beyond looking solely at the 14-day CCI. First, this indicator looks at the price of the underlying asset. What we’re looking for here is either higher highs or lower lows for the price. At the same time, the CCI is being looked at in a similar manner. But, rather than higher highs and lower lows, we are looking for higher lows and lower highs.
So, in essence, if the CCI is in overbought territory (+100), but working its way down, yet the price continues to move even higher, then a sell signal is generated.
Conversely, if the CCI is in oversold territory (-100), but creeping up, and the price continues to sink even further, then a buy signal is generated.
Hence the name of the indicator – Bullish & Bearish Divergence. The goal is to look for instances where the CCI is saying that the overbought or oversold period is ending. But, the price continues to move in the same direction. I suppose the thinking is – that if the price moves further into overbought or oversold territory, then the reversal will be that much more extreme?
As with the previous two indicator strategies, there is no period in which the trader would be holding. A buy or sell signal is always in effect.
There are better alternatives
Though the performance wasn’t as poor as it was for the Emerging Trends indicator, it was still pretty bad. Only SOXL showed any promise.
It should be pointed out that the recommendation by stockcharts.com was to work with a longer period for the CCI (40 days); so as to decrease volatility. But in order to make the comparison of the indicator strategies as apples-to-apples as possible, I kept the period at 14 days.
The average ending balance for a trader who started with $100 and used the Bullish & Bearish Divergence CCI indicator strategy was $85.16. Results were fair ($121.35) for SOXL. But, for DRN, results were the worst among all models ($48.97). It seems to me that the extra sophistication does not pay off here.
4. CCI Correction
The inspiration for this strategy also comes from stockcharts.com.
The CCI Correction indicator strategy combines a long-term analysis with a short-term one.
Weekly CCI
For starters, the weekly CCI is calculated. This is done in the exact same way as the daily CCI. Except it uses the high, low, and close (typical price) for the whole week instead of a day. This means that the CCI Correction gets a later start than some of the other indicator strategies. Since the same data was used for all of these models, 14 weeks worth of weekly CCI information had to be compiled before buy, sell, or hold signals could be generated.
The weekly CCI figure is used to determine if there is a bearish or bullish bias. This is simply done by looking at the weekly CCI figure and ascertaining if it is above +100 (bullish) or below -100 (bearish). Even if it moves out of those ranges, a bullish bias stays in effect until a bearish one appears, and vice versa. The point of the bullish and bearish bias is to determine the longer-term trend of the ETF.
Daily CCI
The next component of the CCI Correction indicator strategy refers back to the daily CCI number. The trader looks for instances where the daily CCI moves above +100 or below -100. Beyond that, the trader is looking for instances where the zero line is crossed after a move above +100 or below -100. If the CCI moves below -100 and then back above zero that is considered bullish. On the other hand, if the CCI moves above +100 and then back below zero, that is considered bearish.
Now, with the long-term (weekly), and the short-term (daily), bullish and bearish indications from the CCI, the trader waits for the two to match. When they do (bullish & bullish, bearish & bearish), then the corresponding buy or sell signal is given.
What should also be noted, is that buy or sell signals will only be generated if they correspond with the bullish or bearish weekly bias. For example, only buy signals will be generated during a long-term bullish trend and sell signals during a long-term bearish trend. Therefore, the CCI Correction indicator strategy will have time periods in which a hold signal is generated.
A lot of potential
It might be due to these holding periods, where the indicator waits for a signal indicating momentum up or down, that causes the CCI correction indicator strategy to perform relatively well.
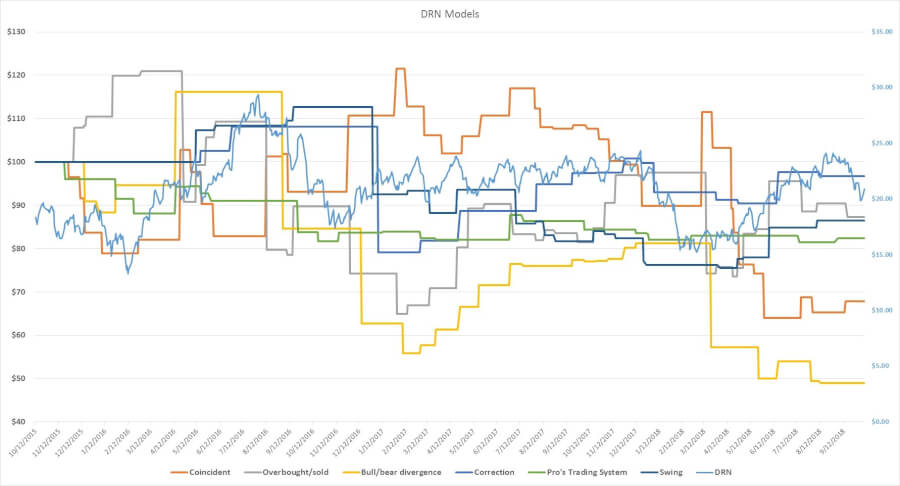
The average return for somebody investing $100 over 3 years was $181.92. This was skewed rather heavily, however, by a $344.46 result for SOXL. DRN and UUP were relatively flat over that 3 year period.
Of the three ETFs examined, the CCI Correction indicator strategy had the best average returns, due mostly to SOXL. However, in these models, this indicator strategy did seem to limit the downside. More modeling would be needed, but if downside can be limited and upside can be limitless, there’s potential for a sound trading strategy.
The CCI Correction indicator strategy is a little more complicated to calculate due to its use of daily and weekly price data. However, a longer-term (e.g. 70 days) daily CCI can be used in lieu of a weekly CCI.
5. Pro’s CCI Trading System
“Pro’s CCI Trading System” is not an official name. It’s what I chose to call the strategy outlined here.
The Pro’s CCI Trading System, like most indicator strategies I suppose, was designed more for charting than a spreadsheet-based analysis. Therefore, I had to make some assumptions when creating this model.
The first thing this indicator strategy looks for is a move of the (daily) CCI above +100 or below -100. Once that happens the next step is to look for a “retracement,” or a move of the price in the opposite direction. For example, if the CCI is above +100, then the trader looks for the price to drop. If the CCI is below -100, then the trader looks for the price to increase. Meanwhile, the CCI must not cross the zero line.
One retracement won’t do, however. In order for the retracement to trigger a signal, it must happen three times in a row. Or, alternatively, the price must move sharply in the same direction as the retracement.
To top it all off – once a position has been entered, “profit” is taken after the CCI hits ±200, or crosses the zero line.
Confused yet?
An example
This is a little difficult to explain in writing so an example might help? If the CCI for an ETF (or any other asset) moved below -100 and then the price increased for three days straight, a sell signal would be generated. Alternatively, a move of the CCI below -100 followed by one sharp move upwards in the price would also generate a sell signal.
Of course, the opposite is true on the buy-side. CCI above +100 and then three consecutive days of price decreases, or a sharp move down in price will generate a buy signal.
I believe the rationale behind this indicator strategy is that once the CCI reaches an extreme (by hitting +100 or -100), then upward or downward momentum is present. The indicator strategy then looks for price movements that are in the opposite direction of the momentum. Either several small ones or one big one. If that happens, then a buy or sell signal is generated.
The Pro’s Trading System is also unique in that it provides exit criteria for positions. The other indicator strategies will certainly provide an opposing signal to the current position, but they don’t necessarily tell you when to take profits.
As mentioned earlier, the use of stops wasn’t employed in these models for the sake of a fair comparison. But, I didn’t consider the exit criteria to be the same as a stop. Rather, just part of the indicator strategy. The result, at least with a 14-day CCI, is that positions aren’t held for very long and the majority of the three years examined in this model were spent holding.
Something’s missing
These long periods of sitting out of the market are reflected, somewhat, in the Pro’s Trading System’s returns. On average this CCI indicator strategy returned $85.45 of the initial $100 invested. There were no extreme results, all three ETFs returned similar amounts with only one ETF ending with a small profit (UUP).
The pros must have another trick up their sleeve. For all the complication involved in calculating and interpreting this indicator strategy, results were pretty lackluster. I like the notion of having an exit plan, but in these models, it seemed that most of your time would be spent holding. Buy and sell signals typically only seemed to last a day or two (using a 14-day CCI). Not long enough to appreciate significantly.
6. CCI Swing
The last CCI indicator strategy I look at is another relatively complicated one. Like the CCI Correction, long-term, weekly pricing information is used to pinpoint buy and sell signals.
Here’s where I found inspiration for this model.
Long and short-term trends
First of all, a 14-week moving average of the price was calculated to ascertain the long-term trend of the ETF. Keep in mind that this is a 14 period average of the weekly typical price. Not an average of 14 week’s worth of daily typical prices. The typical price for a given week is then compared to the 14-week moving average. If it’s below, the ETF is assumed to be in a downward trend. If it’s above, then the ETF is assumed to be in an upward trend.
A similar thing is then done with daily prices. A 14-day moving average is calculated and a trend is determined based on whether the daily typical price of the ETF is above (up) or below (down).
Overbought or oversold?
The next step is to ascertain whether the ETF is overbought or oversold. This is done in the same manner as it was for the Overbought & Oversold indicator strategy. If the 14-day CCI moves above +100 and then below, then the ETF is considered to be overbought. On the flip side, if the CCI moves below -100, and then back above, it is considered to be oversold.
Finally, with the long-term and short-term trends identified, plus the CCI indicator coming out of overbought/oversold territory – a buy, sell, or hold signal can be generated. A buy signal requires that the long-term and short-term trends both be up and that the CCI indicates that the asset is oversold. In order for a sell signal to be generated, the opposite must happen. Both trends must be down and CCI must indicate that the asset is overbought.
Long and short positions will be closed due to a hold signal if either trend changes direction. Also if the CCI indicates that a security has switched from overbought to oversold or vice versa. Like the CCI Correction strategy, signals will only be given that correspond with the long-term trend (buy in an uptrend, sell in a downtrend).
More complication ≠ more returns
You would think that having so many criteria that must match would make for an indicator strategy that’s pretty accurate. That wasn’t the case here, though. This is another indicator strategy that is disproportionately complicated in relation to the returns it provides.
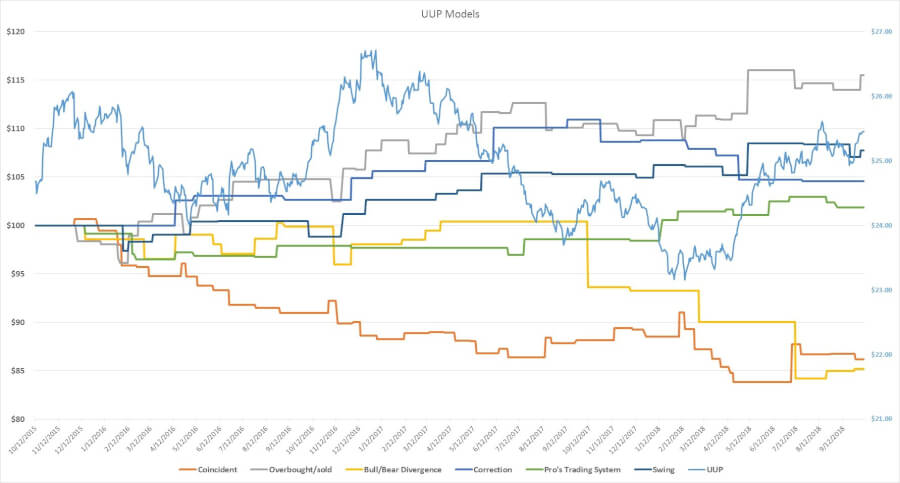
Performance-wise, the CCI Swing indicator strategy took $100 and reduced it to $91.38 on average. UUP was the only ETF to earn a positive return with an ending balance of $107.73
CCI indicator strategy
As touched on before, I don’t presume to imply that three ETFs, out of the entire universe of potential investments, can qualify a particular CCI indicator strategy as good or bad. This was not a scientific undertaking and never pertained to be one. It’s simply a handful of real-life models that can hopefully provide a little direction as to where to dig further for answers.
First of all, remember that stops weren’t utilized. Which could have definitely helped to limit some of the downside in these models. Obviously, sharp increases or decreases in prices (particularly during after-market hours) can render stops useless. But, I don’t think that’s as much of a risk with ETFs. So, I assume (without having tested the theory) that the use of stops would have only increased returns. I hope to put that theory into a model someday soon.
Also, a fairly short-term period was used for the CCI calculation – 14 days. It’s been my experience that, as a rule of thumb, short-term periods can perform really well for certain investments. But, on average, perform worse than longer-term periods.
As you can see in the table below – buying & holding was, almost without exception, the best strategy.
What I take away from this exercise
My conclusions are that I would avoid using the Emerging Trends indicator. It’s rare that I’ve ever seen that strategy beat buying & holding. The Bullish & Bearish Divergence indicator strategy also performed pretty poorly (SOXL notwithstanding).
The Pro’s Trading System and the CCI Swing indicator strategies didn’t do anything impressive either.
The Overbought & Oversold and CCI Correction indicator strategies both provided some extraordinary results and (seemed to) limit downside. Based on what I have seen here I would plug some different historical price information into these models and see if the results are encouraging. If so, I would consider adding these two CCI indicator strategies to my trading toolbox. With the benefit of leverage and stops, there might be potential here to realize some quality profits.
Here’s a look at the charts for each ETF:
(ETF prices are plotted against the right axis)

And here’s the table comparing the results across every ETF and indicator strategy combination.