- The CCI is essentially a measure of the magnitude of today’s price deviation from average compared to that of the past
- A constant is used in the calculation to deliver a result that is consistently between -100 and 100
- The CCI might not be the right choice for excessively volatile assets combined with a short lookback period
How the CCI indicator works
You probably have some inkling about what the CCI indicator is about, or you wouldn’t have searched for it. This post is going to break the CCI indicator down into its individual pieces. More information than you probably wanted or needed.
There’s nothing terribly complicated about the CCI indicator. It’s driven by present and past prices of an asset. Specifically the high, low, and close prices. The equation itself uses fairly simple mathematics – subtraction, multiplication, and division. Some of the components that are subtracted, multiplied, and divided can get a little more complicated.
The CCI indicator is an oscillator. This means that it rises above and falls below a particular number (zero). There is theoretically no limit to how high or low the CCI can go.
How to interpret the CCI is up for debate. Some people look to it to tell them if an asset is overbought or oversold. Others might use it to tell them if an asset has momentum to the up or downside. Still, others might only use it to confirm signals gleaned from other indicators. How to interpret the indicator is an intensive topic that merits study unto itself. I’ve posted several other posts, with more to come, on the subject of buy and sell signals from the CCI indicator.
The CCI indicator calculation
The CCI indicator calculation is as follows:
(Typical price – ## period simple moving average of the typical price) ÷ (.015 × average deviation from ## period simple moving average of the typical price)
What? Alright, it might not seem so simple when it’s typed out like that, but I’ll break it down further.
First, let’s clarify some of the terms in the calculation.
Typical price
Typical price is the average of a day’s high, low, and close price. For instance, if a stock had the following:
High: $26.00
Low: $24.00
Close: $25.00
The Typical price would be $25 [(26 + 24 + 25) ÷ 3]. The same as the Close price, in this instance. Rather than just relying on the Close price, the Typical price aims to capture an asset’s total price movement for the day in one number. Easy enough.
## period simple moving average of the typical price
The ## period simple moving average of the typical price is an average of previous days’ typical prices. The ## can be 5, 14, 20, 34… whatever you want. This number gives us one amount that embodies all of the price movement over 5, 14, 20, 34… periods.
No fancy-schmancy moving averages here (e.g. exponential, smoothed, linear weighted, etc). Just your garden-variety (simple) moving average.
The “constant”
The .015 figure is known as the “constant.” If you’re running your own CCI indicator calculation, you can certainly change it. But, I wouldn’t recommend it. I’ll go into why, later.
You usually won’t see it changed if you use any sort of service that provides you with CCI data.
Average deviation from ## period simple moving average of the typical price
Finally, there’s the average deviation from ## period simple moving average of the typical price. Which sounds a little clunky, but is fairly simple.
You’ll use the same period that you used for the simple moving average (5, 14, 20, 34… whatever). For simplicity’s sake, let’s say that today is Friday and we’ve opted to use a 5-period look-back for our CCI equation.
Here’s what the last week has looked like:
Monday: typical price = $20.00
Tuesday: typical price = $22.00
Wednesday: typical price = $23.00
Thursday: typical price = $26.00
Friday: typical price = $25.00
The 5-period simple moving average of the typical price will, of course, be $24.00.
Now, we’re going to compare the past 5 day’s typical price to this average. We want the absolute value of the difference (e.g. “-4.00” would just be “4.00”).
Monday: $20.00 -$24.00 = $4.00
Tuesday: $22.00 -$24.00 = $2.00
Wednesday: $23.00 -$24.00 = $1.00
Thursday: $26.00 -$24.00 = $2.00
Friday: $25.00 -$24.00 = $1.00
Okay. We have our deviation from the 5-period simple moving average of the typical price. But, the number we want is the average deviation from ## period simple moving average of the typical price. Simple enough, we average the deviations (4, 2, 1, 2, 1) to get $1.50. This is the typical amount the typical price had deviated from the 5-period simple moving average over the past 5 days.
Back to the CCI indicator calculation
With the four components of the CCI indicator calculation now known – we can get our CCI number for the day.
Numerator: $25.00 – $24.00 = $1.00
Denominator: .015 × $1.50 = .0225
CCI = $1.00 ÷ .0225 = 44 (44.44 rounded)
This tells us, in essence, the magnitude of the difference between today’s deviation from average versus the usual deviation from average. The higher or lower the CCI, the greater the magnitude of the difference.
What are the numerator and denominator telling us?
I suppose this is a somewhat subjective question. Here’s how I interpret it.
The numerator tells us how far today’s typical price is from the average price. It is much more volatile than the denominator and therefore has a bigger effect on the CCI. Which makes sense, because the numerator is the deviation for one day, not the average of many days.
The denominator cannot be negative so it is the numerator that determines if the CCI will be positive or negative. For all intents and purposes, the numerator is the CCI.
The denominator serves to give us an easy-to-digest normal range of values for the CCI between -100 and 100. This is what the .015 constant accomplishes. They say this constant should make the CCI fall between those values 70% to 80%.
If the constant were 1.00 instead of .015, then it would essentially be meaningless. But, the CCI would still fall between a particular range 70% to 80% of the time. The range would just be smaller ( -1.5 and 1.5 as shown below). Because, in this case, we would only be looking at today’s deviation from average (the numerator) in relation to the average deviation from average.
Again, it’s my speculation that Donald Lambert, the father of the CCI, included the mean deviation to put today’s deviation from average into perspective. So that the price of an asset wouldn’t matter, only its relationship to the mean deviation. I believe he included the constant so that the CCI could be rounded to a whole number and wouldn’t always be something like 1.4973264. Instead it would be 100 (1.4973264 ÷ .015 = 99.82176, rounded = 100).
Still with me? Probably not. Anyhow, if anyone is still here, let’s dive into each component into a little more depth.
Typical price
The typical price is the most important part of the CCI indicator calculation. A change in today’s typical price is what will trigger a buy or sell signal.
If we look at it deeper we know that it’s the high and low price that really pull the typical price in any one direction. Though each price (high, low, close) is weighted equally, the close will always fall within the high or low.
How much of a price movement does it really take to move the CCI? I took a look at four different investments to see what I could find. Each investment is from a different asset class – stock, Forex, futures (commodities), and crypto.
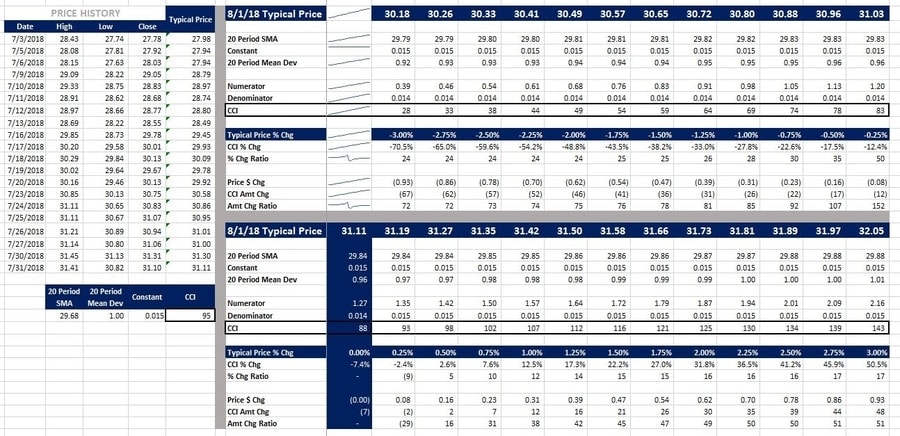
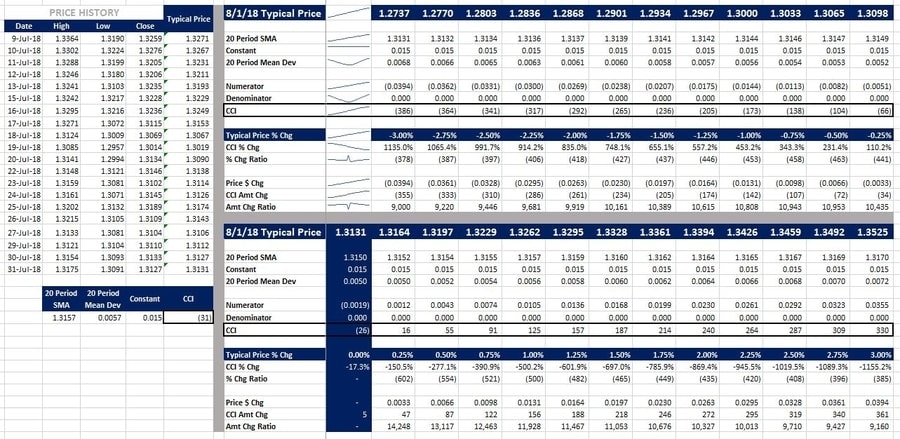
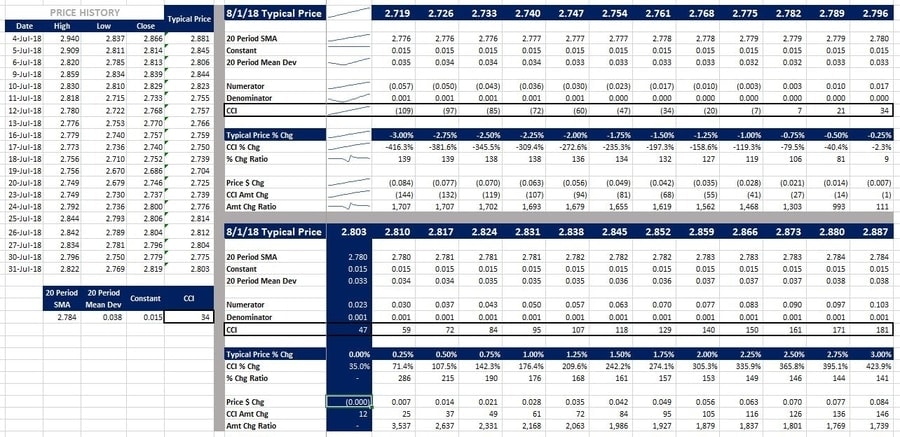
I looked at the effect of a ±3% change in the typical price and the effect that would have on all of the other variables including, of course, the CCI. Below, is a snapshot of what I found.
The images are smaller than is ideal, but they have to be sized down to be remotely useful for mobile visitors. Ctrl + ‘+’ (the plus sign) will zoom your browser on a computer. Also, you can right-click the image and choose “Open image in new tab” (in Chrome) and zoom in on the new tab if that’s easier.
The price history is on the left, decreasing typical prices on the top-right, and increasing typical prices on the bottom-right.
Bank of America Corporation (BAC)
British Pound US Dollar (GBP/USD)
Copper
Stellar USD (XLM/USD)
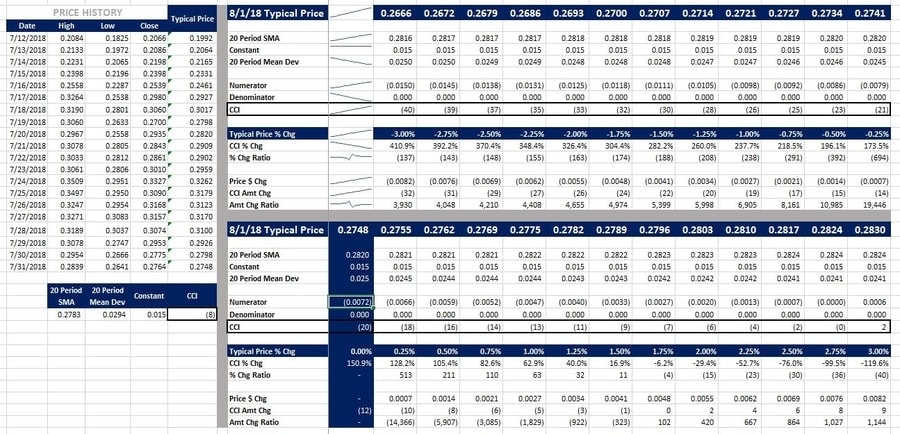
Not surprisingly, a rising typical price results in a rising numerator and a rising CCI (see the sparklines in the top-middle). Correspondingly, the CCI Amt Chg increased with the typical price too.
If the CCI was negative as of 7/31/18, as was the case with GBP/USD and XLM/USD, then the CCI % Chg decreased with an increase in typical price.
What’s also notable, is how much the CCI can change even if the typical price does not (dark blue column, bottom-middle). In the case of XLM/USD, the CCI increased by 151% if the typical price didn’t change on 8/1/18. Why would that happen?
## period simple moving average of the typical price (aka SMA)
In a moving average, two periods matter the most – the newest and the oldest. The period that dropped off has the same impact as the newest period. Even though it’s old news and is no longer figured in your calculation.
Let’s look at Copper. As of 7/31/18, the SMA was 2.784. In order to maintain that SMA, the typical price was going to have to rise by 2.75%!
Also, if we look at XLMUSD, because the typical price on 7/12/18 of .1992 was dropped off, even a decrease in the typical price of -3% would increase the SMA. Since the SMA was destined to increase (within the range of prices in the model) the CCI was likely to stay negative. Only if there’s a 3% or greater increase in typical price, will the CCI move into positive territory. Now, since this is a cryptocurrency, a move of over 3% is entirely possible. In fact, it’s almost guaranteed.
There’s a school of thought that feels that using the median instead of the average is preferable in a lot of situations. Particularly situations where one number (period) can impact an average drastically. If you’re using a moving average for something volatile like crypto and using a small period number (5, 8, 13, even 20…) then it might be more appropriate to use a median instead of an average.
That gives me an idea for a model… I’d be curious to see how models using a median perform relative to those using an average. Because using a median certainly seems more practical. But does that practicality translate into better returns?
Constant
As touched on earlier, the constant is a means of bringing the expected range of the CCI indicator up to -100 to 100; as opposed to say -1.5 to 1.5.
Also, as you might have gathered by the name, it is rarely, if ever, changed. Changing the constant and changing the upper and lower limits would accomplish the same thing.
Want some proof? Take a look at these screenshots from the coincident CCI indicator strategy model for Forex (GBP/USD).
Here, the Constant is “.015,” and the Upper Level and Lower Level are 100 and -100 respectively:
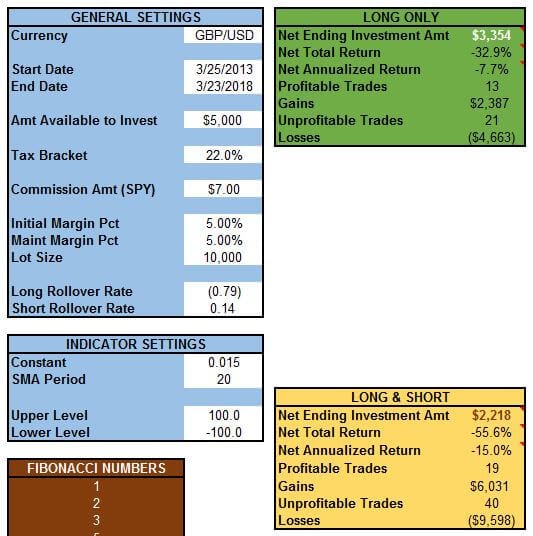
Here, the Constant is “1,” and the Upper Level and Lower Level are 1.5 and -1.5 respectively:
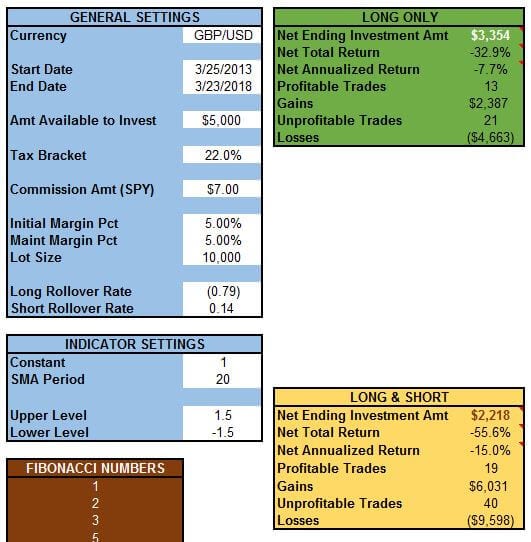
The results are the exact same! Again, it’s my contention that Mr. Lambert added the constant to the calculation to make the result of the CCI calculation more “user-friendly.”
So, if you’re looking to tinker with the settings for your CCI indicator, you might as well adjust the Upper and Lower Levels rather than muddying the waters by toying with the constant too.
Average deviation from ## period simple moving average of the typical price (aka Mean Dev, mean deviation)
Whereas the numerator in the CCI indicator calculation looks at today’s deviation from the SMA. The mean deviation looks at the average deviation over the entire period.
If you’re like me (and like to obsess over silly little details) you might have wondered why the sparkline for the 20 Period Mean Dev sloped up, down, or made a “U” shape (e.g. GBP/USD and Copper). If you look at the screenshots, you’ll notice that the CCI nears zero where the Typical Price is closest to the 20 Period SMA. That, of course, is our numerator (Typical price – ## period simple moving average of the typical price). As it approaches zero, so does the result of the calculation (the CCI). This is also where the 20 Period Mean Dev minimizes too.
Copper:
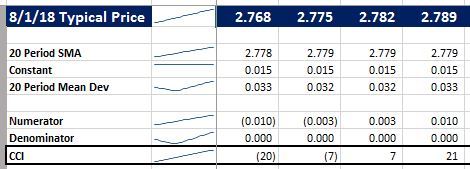
Notice that the 20 Period SMA (2.779) would fall between 2.775 and 2.782. The CCI would also be zero somewhere in between there.
GBP/USD:
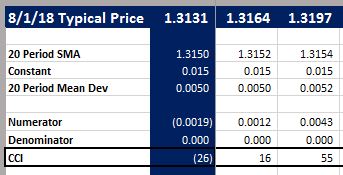
A similar situation happened with GBPUSD. The CCI approaches zero where the Typical Price and 20 Period SMA are equal.
What’s this mean? It means that the Typical Price is not really affecting the 20 Period Mean Dev since it is close to the 20 Period SMA. But…as the Typical Price moves away from the 20 Period SMA (either up or down) the 20 Period Mean Dev is going to increase – because the mean deviation from the SMA is increasing. This is what accounts for the “U” shape. If we looked at a big enough range of typical prices (i.e. beyond ±3%) all of the sparklines would start high, decrease, bottom out, and then rise again.
That is tough to convey in words, so I hope it made a tiny bit of sense.
The final point to make about the mean deviation is the risk of it being zero. If the mean deviation is zero, then the denominator will be zero. Since you can’t divide by zero, your CCI calculation is busted – at least for that day. I’ve run quite a few models with a CCI calculation and I’ve never seen that happen. It’s obviously an unlikely event. But, if you find yourself working with the CCI in Excel and get a #DIV0! error that might be the reason.
The CCI indicator explained – in way more detail than you wanted
That more or less sums up everything I could glean from the CCI indicator calculation.
It is, in large part, a reflection of what the price is doing today. An asset that is prone to sudden, sharp movements is probably more likely to have a CCI that shoots above 100 (or below -100) and then back the opposite direction. In cases like that, the CCI indicator might not be the appropriate tool for trading.
That’s why I create models. To attempt to ascertain what strategies work best with what assets. If you’d like to stay abreast of what I’m doing here, just check every week or so. I try to get a new post up at least that often.
Is there anything I overlooked while explaining the CCI indicator?
Join the conversation on Twitter!
Contents
- How the CCI indicator works
- The CCI indicator calculation
- Typical price
- ## period simple moving average of the typical price (aka SMA)
- Constant
- Average deviation from ## period simple moving average of the typical price (aka Mean Dev, mean deviation)
- The CCI indicator explained – in way more detail than you wanted