A revenue growth analysis is the examination of changes in total revenue. Further insights can be gained by looking at revenue growth by categories such as segments and geographic regions. Analyzing unit sales and price changes is also valuable.
Understanding how and why revenue is changing helps with forecasting the future performance of the company you’re analyzing. A quantitative and qualitative understanding of sales is critical for investors performing a thorough fundamental analysis.
Fisher, Point 4 and Facebook
This is another post in the series on Philip Fisher’s 15 Points. These points are from his book Common Stocks and Uncommon Profits. Here, I’ll begin to address Point 4 – “Does the company have an above-average sales organization?”
The plan now is to write eight posts on Point 4. Each will address a different sales metric. These sales metrics can be used to size up the effectiveness of the sales organization for the company you’re analyzing.
As with past CSaUP posts, I will be using an example company to apply the subject matter in real-life. For all of these posts on sales organization effectiveness, the plan is to refer to Facebook, Inc. (FB). A company that you’re probably familiar with.
Download the Evaluation of the Effectiveness of the Sales Organization workbook
This workbook will include all the worksheets used in the Point 4 posts.
Complete the form below and click Submit.
A link to the Google Sheet will be emailed to you.
Once you’re in the spreadsheet, click on File > Make a copy to edit. I’ll no longer be responding to “Requests for access.”
What is an analysis of sales growth?
First of all, it’s worth noting, I suppose, that the terms “sales” and “revenue” are synonymous.
Sales growth is stated as a percentage. Its purpose is to give you an idea of how aggressively revenue is increasing or decreasing. Typically, it is stated on an annual basis. This allows for easy comparison to other years or between different companies.
An analysis of sales growth can’t only be done on Total revenue. It can be done on different categories of revenue. For instance, different segments or geographic regions. Units/quantities and prices too.
Not every organization is going to approach sales in the same way. Some will depend on salespeople. Others, more on advertising and marketing. Nevertheless, no matter which department is in charge, know that someone is responsible for growing sales. It’s simply too important of a matter for no one to care.
Why perform an analysis of sales growth?
My last post was on how to create a stock analysis spreadsheet. In the post and the worksheet, it was shown how important revenue was to forecasting future earnings. It’s future earnings that dictate the current value of a stock.
Most products/services aren’t fascinating enough to reach their maximum potential on their own. That’s what Philip Fisher purportedly said, anyway. They need the help of “an above-average sales organization.” Growth investing depends on companies with high revenue growth. High revenue growth depends on a kick-ass sales team. An analysis of sales growth is step 1 in finding out if their sales team is kick-ass.
There are benefits beyond aiding in revenue forecasting and giving a pass/fail for Point 4. Performing an analysis of sales growth has another huge benefit. Looking at sales trends from several different angles will help you gain a better understanding of the company. An understanding that will round out your analysis.
How to analyze sales growth
To begin with, we analyze the big number – Total revenue.
The format is similar to the stock analysis spreadsheet. We examine three years of quarters and five whole years of history. The best source for this information is the company’s SEC filings.
For quarterly revenue, we want to compare each to the same quarter in the previous year. Not the previous quarter. There’s nothing wrong, per se, with comparing revenue growth Q/Q. But, comparing Y/Y will avoid the volatility that might come with seasonality.
Analyze revenue for Segments and Geographies too, if this information is available.
Analyzing units/quantities
Furthermore, try to get your hands on data regarding units/quantities sold. Even if you have to look outside of the SEC filings.
Why?
Because increasing revenue by increasing prices is fine. But, it doesn’t tell us about the effectiveness of the sales organization, though. It’s not real revenue growth (Source). Real revenue growth comes from selling larger quantities.
Analyze Units/Qty Sold by Segment or Geographic area. Whichever is easier to get your hands on.
With Units/Qty Sold data, Revenue per Unit/Qty information will also be calculated. It’s here that you can get an idea of your company’s trends in pricing.
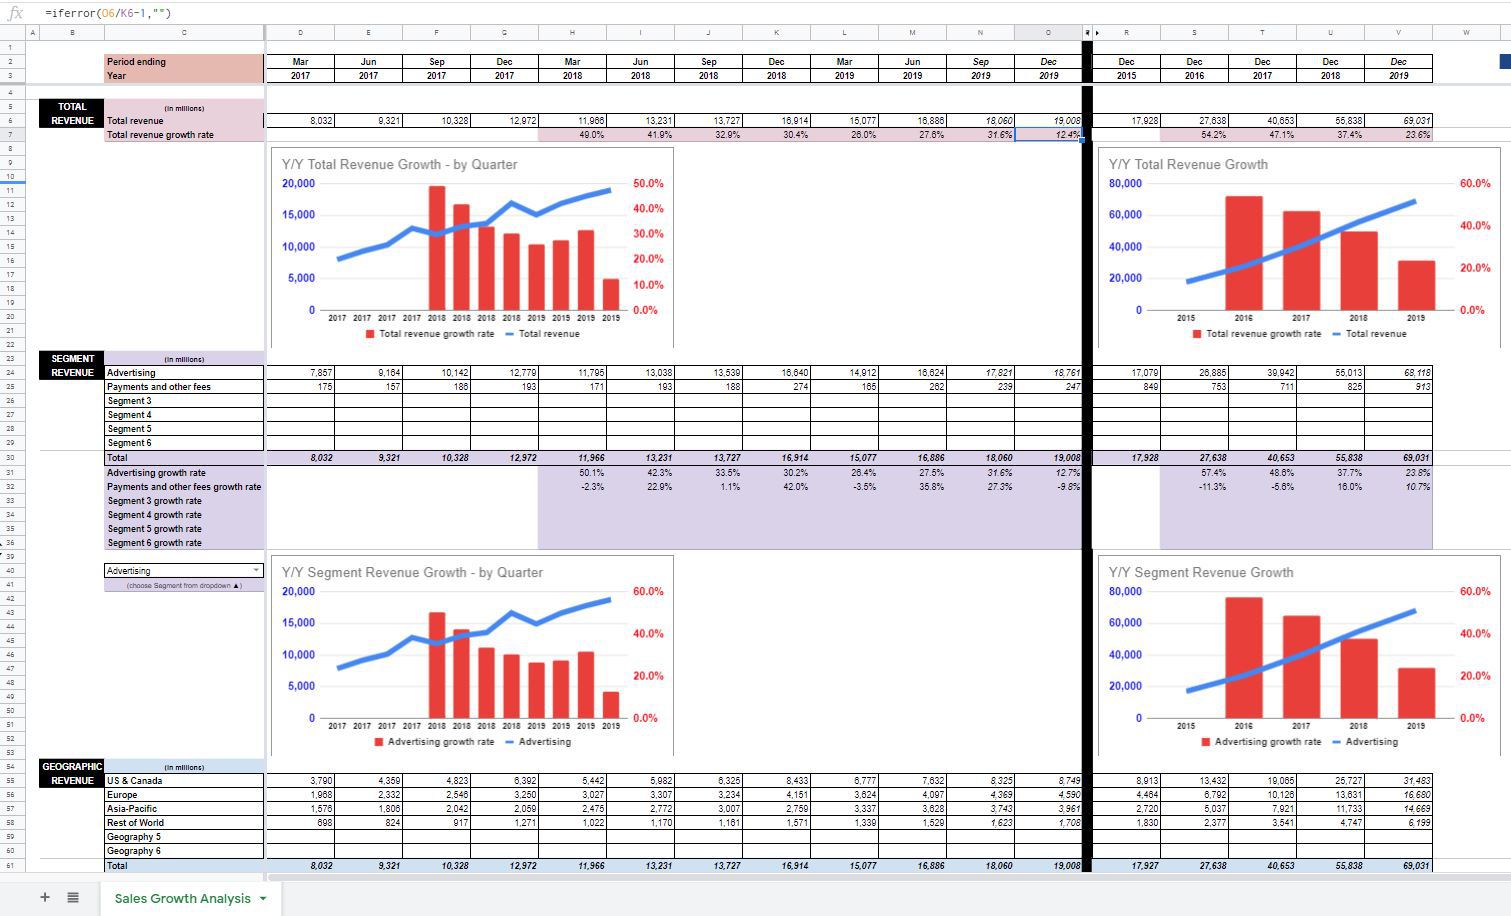
Sales growth analysis of Facebook
Total revenue continues to grow for Facebook. The rate of growth, however, is trending down. Trending down from very high levels grant you. For 2019, I forecast that Total revenue growth will remain very healthy – near $69 billion. This would represent an increase of approximately 25% over 2018.
The Segment Revenue section shows me that most of their revenue is from Advertising. Payments and other fees are rather immaterial.
From a Geographic standpoint, sales growth in the Asia-Pacific region seems to be driving Total revenue growth.
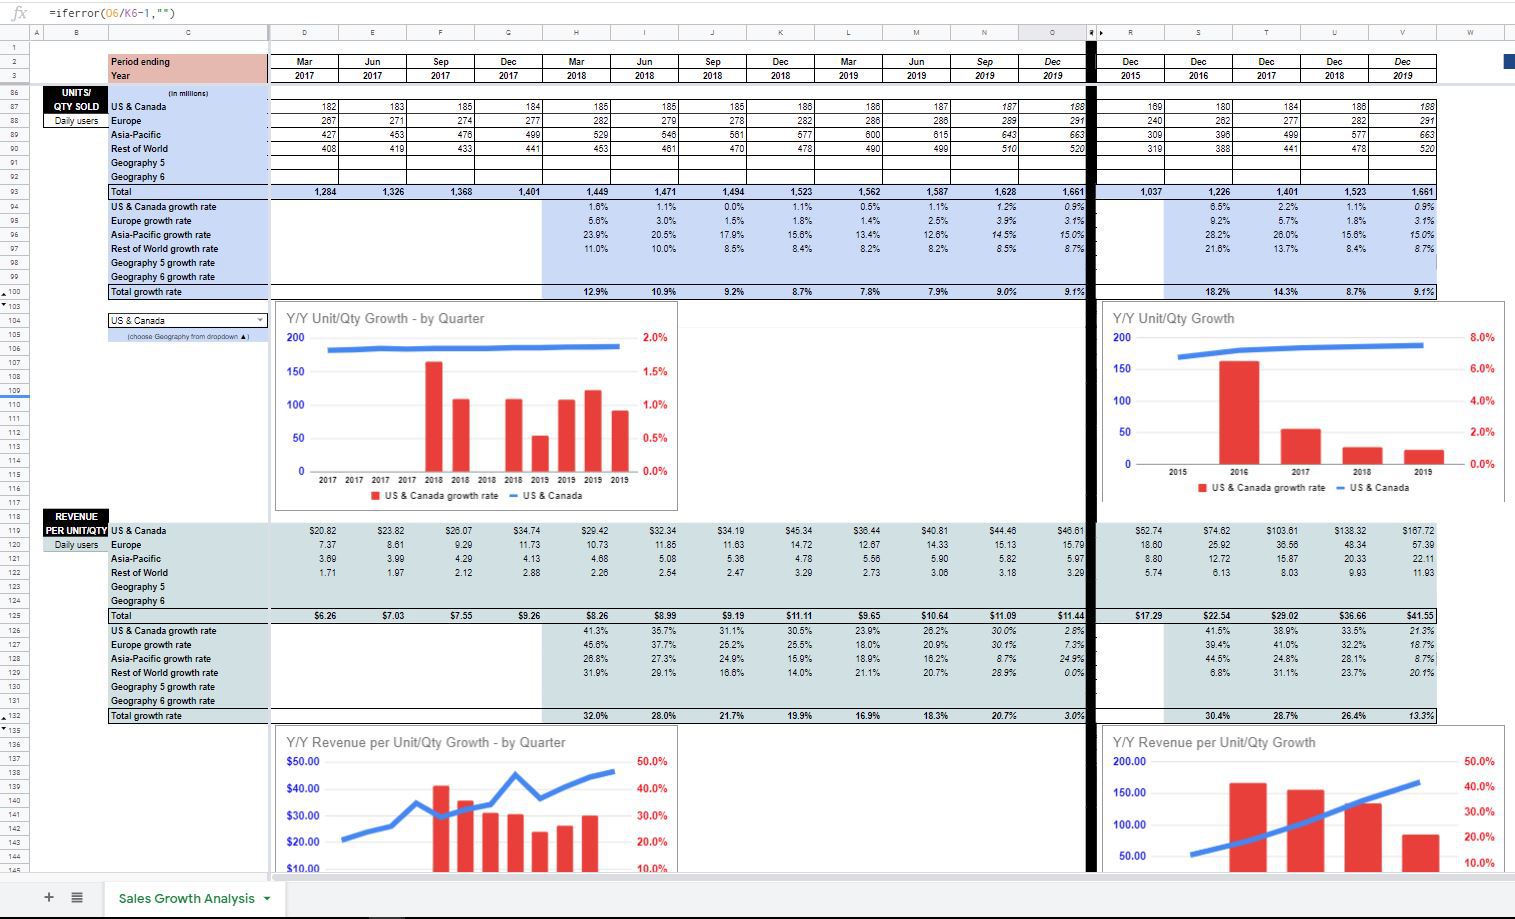
When we look at Daily users, the picture seems to get clearer. Daily user growth in the US & Canada and Europe is essentially flat. It is aggressive in the Asia-Pacific region and solid for the Rest of World.
Looking at the Revenue per Daily User data, we see that it’s “prices” that have been the primary driver behind Total revenue sales growth. Of course, users don’t pay to use Facebook. But, since the users are the product – advertisers pay for access to them.
In the US & Canada, Facebook has more than tripled its Revenue per Daily user over the past five years. Revenue per Daily user hasn’t been quite as aggressive for Europe. Asia-Pacific and Rest of World have seen Revenue per Daily user start to level off.
Facebook sales growth analysis going forward
I would assume that, at some point, the same will happen in the US & Canada and Europe. Facebook will reach a point where little more Revenue per Daily user can be wrung out. Additionally, it seems unlikely that the number of users in these Geographies will contribute to revenue growth either.
Daily user growth in Asia-Pacific and Rest of World will probably hedge some of the effects of the slowdown in the US & Canada and Europe. At some point, too, Facebook will run out of Daily users in the Asia-Pacific and Rest of World regions. It’s at that point, Facebook will reach the status of a mature company. Then, they will have to pursue growth through other means.
Sales growth analysis
Are there other ways to analyze sales growth beyond the ones mentioned here?
Do you agree that increasing prices don’t represent true sales growth?
What are your thoughts on Facebook’s future sales growth?