Cannabis (aka pot or marijuana) stocks are publicly traded securities that represent equity shares of companies in that industry. Many of the largest companies in the cannabis industry were founded in 2013-2014. Despite the immaturity of the industry, many of these companies are not managed by their founders. Most of the largest companies in the cannabis industry are headquartered in Canada. Relaxed marijuana laws in North America between the 1990s and 2010s have given birth to this industry and these companies.
Updated 04/05/21.
Feedback? Let me know on Twitter.
Financial info is pulled from Yahoo! Finance. No guarantee of accuracy is made.
What cannabis stocks are analyzed?
| Price | Financial Info Dated | Currency | Ticker | Company Name |
|---|---|---|---|---|
| $9.03 | 12/31/20 | USD | ACB | Aurora Cannabis Inc. |
| $3.05 | 12/31/20 | USD | ACRDF | Acreage Holdings, Inc. |
| $18.03 | 11/30/20 | USD | APHA | Aphria Inc. |
| $30.52 | 12/31/20 | USD | AYRWF | Ayr Wellness Inc. |
| $0.91 | 9/30/20 | USD | CANN | General Cannabis Corp |
| $6.52 | 12/31/20 | USD | CCHWF | Columbia Care Inc. |
| $31.85 | 12/31/20 | USD | CGC | Canopy Growth Corporation |
| $0.76 | 12/31/18 | USD | CNTTQ | CannTrust Holdings Inc. |
| $1.95 | 12/31/20 | USD | CRBP | Corbus Pharmaceuticals Holdings, Inc. |
| $13.40 | 12/31/20 | USD | CRLBF | Cresco Labs Inc. |
| $9.32 | 12/31/20 | USD | CRON | Cronos Group Inc. |
| $15.23 | 12/31/20 | USD | CURLF | Curaleaf Holdings, Inc. |
| $4.65 | 12/31/20 | USD | CWBHF | Charlotte’s Web Holdings, Inc. |
| $0.23 | 9/30/20 | USD | EMHTF | Emerald Health Therapeutics, Inc. |
| $0.90 | 10/31/20 | USD | FFLWF | Fire & Flower Holdings Corp. |
| $0.20 | 12/31/20 | USD | FUAPF | Global Cannabis Applications Corp. |
| $48.48 | 12/31/20 | USD | GRWG | GrowGeneration Corp. |
| $30.29 | 12/31/20 | USD | GTBIF | Green Thumb Industries Inc. |
| $217.80 | 12/31/20 | USD | GWPH | GW Pharmaceuticals plc |
| $6.41 | 1/31/21 | USD | HEXO | HEXO Corp. |
| $0.65 | 10/31/20 | USD | HITIF | High Tide Inc. |
| $6.93 | 9/30/20 | USD | JUSHF | Jushi Holdings Inc. |
| $1.36 | 11/30/20 | USD | KSHB | KushCo Holdings, Inc. |
| $0.39 | 12/31/20 | USD | MMNFF | MedMen Enterprises Inc. |
| $2.78 | 12/31/20 | USD | NBEV | NewAge, Inc. |
| $3.43 | 11/30/20 | USD | OGI | OrganiGram Holdings Inc. |
| $6.37 | 9/30/20 | USD | PLNHF | Planet 13 Holdings Inc. |
| $2.20 | 12/31/20 | USD | SHWZ | Medicine Man Technologies, Inc. |
| $1.07 | 12/31/20 | CAD | SNDL | Sundial Growers Inc. |
| $0.21 | 12/31/20 | USD | SPRWF | The Supreme Cannabis Company, Inc. |
| $45.93 | 12/31/20 | USD | TCNNF | Trulieve Cannabis Corp. |
| $0.25 | 12/31/20 | USD | TGODF | The Green Organic Dutchman Holdings Ltd. |
| $21.96 | 12/31/20 | USD | TLRY | Tilray, Inc. |
| $10.50 | 12/31/20 | USD | TRSSF | TerrAscend Corp. |
| $0.32 | 12/31/20 | USD | TRTC | Terra Tech Corp. |
| $2.39 | 11/30/20 | USD | VLNCF | The Valens Company Inc. |
| $2.60 | 9/30/20 | USD | VREOF | Vireo Health International, Inc. |
| $0.10 | 9/30/20 | USD | ZBISF | Zenabis Global Inc. |
| $4.66 | 12/31/20 | USD | ZYNE | Zynerba Pharmaceuticals, Inc. |
All dollar amounts will be in thousands, Note those cannabis stocks with dated financials and currencies other than USD.
Village Farms International, Inc. (VFF) not included due to cannabis only comprising approximately 15% of revenue
Pick the best cannabis stocks with revenue analysis
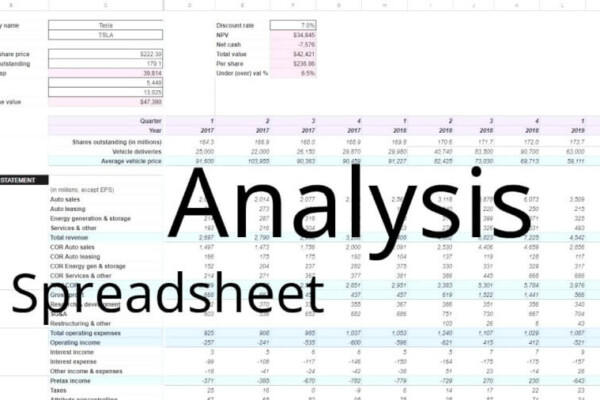
Revenue analysis helps growth investors to determine which stocks have the greatest potential for an extraordinary increase in sales. Remarkable sales results can often swiftly translate into remarkable stock performance. One way to perform revenue analysis is to compare period over period growth. Spreadsheets are ideal for performing a comprehensive revenue analysis.
| Ticker | Company Name | Quarterly Rev Curr Qtr | Quarterly Rev Growth Q/Q | Annual Rev Curr Year | Annual Rev Growth Y/Y |
|---|---|---|---|---|---|
| ACB | Aurora Cannabis… | 67,673 | -0.2% | 278,906 | 12.5% |
| ACRDF | Acreage Holding… | 31,506 | -0.7% | 114,545 | 54.6% |
| APHA | Aphria Inc. | 160,532 | 10.9% | 542,239 | 128.7% |
| AYRWF | Ayr Wellness In… | 47,765 | 5.0% | 155,114 | 106.3% |
| CANN | General Cannabi… | 1,586 | -8.6% | 3,666 | -20.6% |
| CCHWF | Columbia Care I… | 76,064 | 56.2% | 179,503 | 131.7% |
| CGC | Canopy Growth C… | 152,528 | 12.8% | 398,772 | 76.2% |
| CNTTQ | CannTrust Holdi… | ? | 45,645 | 120.5% | |
| CRBP | Corbus Pharmace… | 658 | -46.5% | 3,937 | -89.1% |
| CRLBF | Cresco Labs Inc… | 170,843 | 14.7% | 476,251 | 270.5% |
| CRON | Cronos Group In… | 17,046 | 50.1% | 46,719 | 96.7% |
| CURLF | Curaleaf Holdin… | 230,253 | 26.2% | 626,637 | 183.5% |
| CWBHF | Charlotte’s Web… | 26,927 | 7.0% | 95,226 | 0.7% |
| EMHTF | Emerald Health … | 3,373 | 36.0% | 20,319 | 943.1% |
| FFLWF | Fire & Flower H… | 33,119 | 15.8% | 51,106 | 100.0% |
| FUAPF | Global Cannabis… | 0 | 100.0% | 0 | 100.0% |
| GRWG | GrowGeneration … | 61,925 | 12.6% | 193,365 | 143.4% |
| GTBIF | Green Thumb Ind… | 177,227 | 12.8% | 556,573 | 157.2% |
| GWPH | GW Pharmaceutic… | 148,222 | 8.1% | 527,205 | 69.3% |
| HEXO | HEXO Corp. | 32,880 | 11.6% | 80,784 | 69.9% |
| HITIF | High Tide Inc. | 26,830 | 15.6% | 83,265 | 166.1% |
| JUSHF | Jushi Holdings … | 24,913 | 66.8% | 10,229 | 100.0% |
| KSHB | KushCo Holdings… | 26,761 | 1.1% | 113,837 | -23.6% |
| MMNFF | MedMen Enterpri… | 33,776 | -5.2% | 157,112 | 20.9% |
| NBEV | NewAge, Inc. | 90,422 | 44.2% | 279,471 | 10.2% |
| OGI | OrganiGram Hold… | 19,331 | -5.2% | 86,795 | 7.9% |
| PLNHF | Planet 13 Holdi… | 22,797 | 111.8% | 63,595 | 200.4% |
| SHWZ | Medicine Man Te… | 7,943 | 6.9% | 24,001 | 93.5% |
| SNDL | Sundial Growers… | 13,853 | 7.7% | 60,918 | -19.7% |
| SPRWF | The Supreme Can… | 18,311 | 54.3% | 39,749 | -5.0% |
| TCNNF | Trulieve Cannab… | 168,437 | 20.9% | 521,533 | 106.3% |
| TGODF | The Green Organ… | 9,264 | 89.9% | 21,495 | 96.2% |
| TLRY | Tilray, Inc. | 56,560 | 10.0% | 210,482 | 26.1% |
| TRSSF | TerrAscend Corp… | 65,322 | 28.2% | 198,318 | 133.7% |
| TRTC | Terra Tech Corp… | 4,481 | 46.8% | 14,287 | -49.1% |
| VLNCF | The Valens Comp… | 16,043 | -11.5% | 83,778 | 44.2% |
| VREOF | Vireo Health In… | 11,943 | 11.0% | 29,956 | 100.0% |
| ZBISF | Zenabis Global … | 23,722 | -13.3% | 66,505 | 102.8% |
| ZYNE | Zynerba Pharmac… | 0 | 100.0% | 0 | 100.0% |
Cannabis stocks are attractive, in part, because of their growth potential. Analyzing revenue growth helps you to identify those cannabis stocks that have the most potential. Compare your favorite cannabis stock with the competition. Coupled with the margin and leverage analysis, you can decide which cannabis stocks you’d like to research further.
Learn more about analyzing revenue growth here.
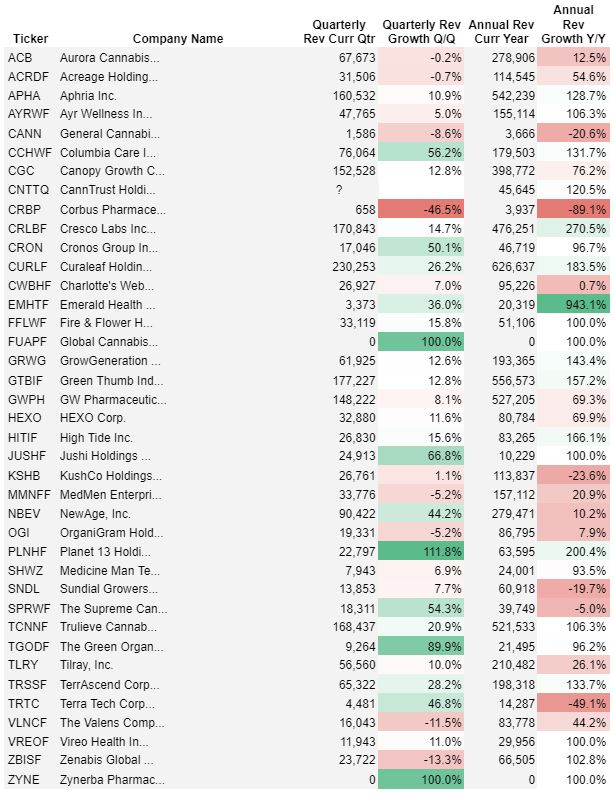
Quarterly Revenue Growth Q/Q compares quarterly revenue to the previous quarter. For example, Q2 is compared to Q1.
Annual Revenue Growth Y/Y compares the recently reported fiscal year’s revenue to the previous fiscal year.
How are the margins for your favorite cannabis stocks?
A margin analysis builds on a revenue analysis. It tells investors how costs are eating into revenue and lowering net profit. Margins are calculated by comparing different types of profit with revenue. Spreadsheets work well for calculating gross, operating, and net margins. Margins can be compared to prior periods and competing companies. A margin analysis can be performed every quarter as new financial information is published.
| Ticker | Company Name | Gross Profit Curr Year | Gross Margin | Operating Profit Curr Year | Operating Margin | Net Profit Curr Year | Net Margin |
|---|---|---|---|---|---|---|---|
| ACB | Aurora Cannabis… | -33,539 | -12.0% | -486,885 | -174.6% | -3,283,671 | -1177.3% |
| ACRDF | Acreage Holding… | 49,158 | 42.9% | -143,069 | -124.9% | -286,588 | -250.2% |
| APHA | Aphria Inc. | 190,975 | 35.2% | 2,677 | 0.5% | -84,634 | -15.6% |
| AYRWF | Ayr Wellness In… | 103,101 | 66.5% | 19,629 | 12.7% | -176,333 | -113.7% |
| CANN | General Cannabi… | 1,199 | 32.7% | -8,862 | -241.7% | -14,804 | -403.8% |
| CCHWF | Columbia Care I… | 65,977 | 36.8% | -74,097 | -41.3% | -110,776 | -61.7% |
| CGC | Canopy Growth C… | -31,684 | -7.9% | -1,024,857 | -257.0% | -1,321,326 | -331.3% |
| CNTTQ | CannTrust Holdi… | 36,493 | 79.9% | -8,817 | -19.3% | -13,554 | -29.7% |
| CRBP | Corbus Pharmace… | ? | 0.0% | -122,810 | -3119.4% | -111,269 | -2826.2% |
| CRLBF | Cresco Labs Inc… | 283,940 | 59.6% | 55,841 | 11.7% | -81,925 | -17.2% |
| CRON | Cronos Group In… | -25,833 | -55.3% | -179,347 | -383.9% | -73,137 | -156.5% |
| CURLF | Curaleaf Holdin… | 390,513 | 62.3% | 63,684 | 10.2% | -61,735 | -9.9% |
| CWBHF | Charlotte’s Web… | 52,255 | 54.9% | -52,470 | -55.1% | -47,186 | -49.6% |
| EMHTF | Emerald Health … | -14,469 | -71.2% | -51,012 | -251.1% | -111,141 | -547.0% |
| FFLWF | Fire & Flower H… | 18,608 | 36.4% | -24,084 | -47.1% | -32,594 | -63.8% |
| FUAPF | Global Cannabis… | 0 | 0.0% | -1,306 | 0.0% | -1,665 | -100.0% |
| GRWG | GrowGeneration … | 51,048 | 26.4% | 8,438 | 4.4% | 5,328 | 2.8% |
| GTBIF | Green Thumb Ind… | 304,169 | 54.7% | 106,107 | 19.1% | 14,993 | 2.7% |
| GWPH | GW Pharmaceutic… | 489,674 | 92.9% | -51,765 | -9.8% | -558,128 | -105.9% |
| HEXO | HEXO Corp. | -57,975 | -71.8% | -163,682 | -202.6% | -546,489 | -676.5% |
| HITIF | High Tide Inc. | 30,812 | 37.0% | 1,373 | 1.6% | -6,354 | -7.6% |
| JUSHF | Jushi Holdings … | 4,823 | 47.2% | -30,672 | -299.9% | -30,611 | -299.3% |
| KSHB | KushCo Holdings… | 7,572 | 6.7% | -63,742 | -56.0% | -77,656 | -68.2% |
| MMNFF | MedMen Enterpri… | 58,121 | 37.0% | -192,749 | -122.7% | -247,264 | -157.4% |
| NBEV | NewAge, Inc. | 177,489 | 63.5% | -30,112 | -10.8% | -39,344 | -14.1% |
| OGI | OrganiGram Hold… | -56,490 | -65.1% | -97,856 | -112.7% | -136,157 | -156.9% |
| PLNHF | Planet 13 Holdi… | 35,975 | 56.6% | 1,498 | 2.4% | -6,658 | -10.5% |
| SHWZ | Medicine Man Te… | 6,774 | 28.2% | -22,903 | -95.4% | -19,417 | -80.9% |
| SNDL | Sundial Growers… | -49,869 | -81.9% | -97,272 | -159.7% | -239,683 | -393.5% |
| SPRWF | The Supreme Can… | 5,480 | 13.8% | -62,124 | -156.3% | -139,720 | -351.5% |
| TCNNF | Trulieve Cannab… | 386,418 | 74.1% | 218,367 | 41.9% | 62,999 | 12.1% |
| TGODF | The Green Organ… | 6,114 | 28.4% | -41,864 | -194.8% | -182,541 | -849.2% |
| TLRY | Tilray, Inc. | 24,655 | 11.7% | -132,176 | -62.8% | -271,073 | -128.8% |
| TRSSF | TerrAscend Corp… | 145,191 | 73.2% | 59,705 | 30.1% | -155,123 | -78.2% |
| TRTC | Terra Tech Corp… | 3,600 | 25.2% | -21,002 | -147.0% | -30,117 | -210.8% |
| VLNCF | The Valens Comp… | 25,724 | 30.7% | -20,100 | -24.0% | -20,682 | -24.7% |
| VREOF | Vireo Health In… | 10,841 | 36.2% | -19,066 | -63.6% | -57,010 | -190.3% |
| ZBISF | Zenabis Global … | 46,363 | 69.7% | -30,756 | -46.2% | -125,331 | -188.5% |
| ZYNE | Zynerba Pharmac… | 0 | 0.0% | -52,063 | 0.0% | -51,337 | -100.0% |
Cannabis stocks aren’t all profitable. In fact, very few are “in the black.” There are a few, though, that are carrying revenue toward the bottom line.
Here’s where you can learn more about margin analysis.
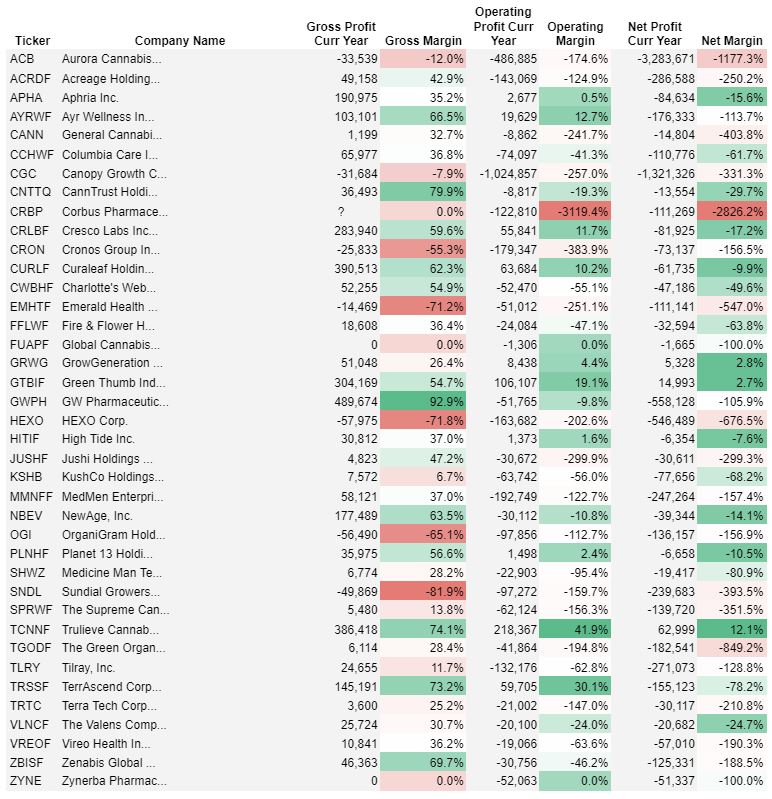
Gross Margin = Gross Profit Curr Year ÷ Annual Rev Curr Year. Be wary of cannabis stocks with negative gross margins. It’s one thing to not yet be profitable in a relatively young industry such as this. It’s quite another to not earn enough revenue to cover the cost of bringing your product to market.
Operating Margin = Operating Profit Curr Year ÷ Annual Rev Curr Year. Poor gross margins translate into poor operating (and net) margins. Some of these cannabis companies are young and spending a lot of money to secure market share. That’s understandable. But, beware of cannabis companies that dump money, year after year, into operating expenses and never earn a return on that investment.
Net Margin = Net Profit Curr Year ÷ Annual Rev Curr Year. Ultimately, your cannabis stock should earn ever-increasing profit. That’s the goal, anyways.
Will leverage help your cannabis stock earn more profit?
Leverage, in business, means utilizing fixed costs to earn extraordinary returns. Leverage comes in two forms – operating and financial. Leverage figures are calculated by comparing the current income statement to the previous period. Quarterly and yearly leverage calculations can be performed in a spreadsheet template. Investors can benefit from those extraordinary operating and net income results through a rising stock price.
| Ticker | Company Name | Degree of Operating Leverage | Interest Expense Current Year | Degree of Financial Leverage |
|---|---|---|---|---|
| ACB | Aurora Cannabis… | 5.1 | 77,538 | 0.9 |
| ACRDF | Acreage Holding… | -0.4 | 15,853 | 0.9 |
| APHA | Aphria Inc. | -0.8 | 34,376 | -0.1 |
| AYRWF | Ayr Wellness In… | -1.5 | 4,116 | 1.3 |
| CANN | General Cannabi… | 1.1 | 2,365 | 0.8 |
| CCHWF | Columbia Care I… | -0.1 | 13,831 | 0.8 |
| CGC | Canopy Growth C… | 1.1 | 6,716 | 1.0 |
| CNTTQ | CannTrust Holdi… | -1.6 | 478 | 0.9 |
| CRBP | Corbus Pharmace… | -0.7 | 1,028 | 1.0 |
| CRLBF | Cresco Labs Inc… | -1.0 | 40,907 | 3.7 |
| CRON | Cronos Group In… | 0.6 | 186 | 1.0 |
| CURLF | Curaleaf Holdin… | -1.8 | 69,002 | -12.0 |
| CWBHF | Charlotte’s Web… | 166.9 | 1,260 | 1.0 |
| EMHTF | Emerald Health … | 0.0 | 0 | 1.0 |
| FFLWF | Fire & Flower H… | 0.0 | 16,409 | 0.6 |
| FUAPF | Global Cannabis… | -0.7 | 31 | 1.0 |
| GRWG | GrowGeneration … | 2.1 | 14 | 1.0 |
| GTBIF | Green Thumb Ind… | -3.1 | 18,667 | 1.2 |
| GWPH | GW Pharmaceutic… | -0.8 | 1,121 | 1.0 |
| HEXO | HEXO Corp. | 1.3 | 10,043 | 0.9 |
| HITIF | High Tide Inc. | -0.6 | 8,000 | -0.2 |
| JUSHF | Jushi Holdings … | 312.3 | 3,253 | 0.9 |
| KSHB | KushCo Holdings… | -1.6 | 6,076 | 0.9 |
| MMNFF | MedMen Enterpri… | -0.6 | 49,487 | 0.8 |
| NBEV | NewAge, Inc. | -3.5 | 2,383 | 0.9 |
| OGI | OrganiGram Hold… | -214.7 | 6,008 | 0.9 |
| PLNHF | Planet 13 Holdi… | -0.7 | 1,307 | 7.8 |
| SHWZ | Medicine Man Te… | 0.4 | 0 | 1.0 |
| SNDL | Sundial Growers… | -3.2 | 9,104 | 0.9 |
| SPRWF | The Supreme Can… | -650.4 | 17,211 | 0.8 |
| TCNNF | Trulieve Cannab… | -0.2 | 20,237 | 1.1 |
| TGODF | The Green Organ… | -0.4 | 5,871 | 0.9 |
| TLRY | Tilray, Inc. | -1.5 | 39,219 | 0.8 |
| TRSSF | TerrAscend Corp… | -1.5 | 14,091 | 1.3 |
| TRTC | Terra Tech Corp… | 0.6 | 2,932 | 0.9 |
| VLNCF | The Valens Comp… | -7.8 | 685 | 1.0 |
| VREOF | Vireo Health In… | 135.8 | 5,184 | 0.8 |
| ZBISF | Zenabis Global … | -7.2 | 12,658 | 0.7 |
| ZYNE | Zynerba Pharmac… | 0.5 | 0 | 1.0 |
Leverage can help amplify your cannabis stock’s margins. It can also compound poor management decisions. Leverage comes in two basic flavors – financial and operating.
Here’s where you can find out more about operating leverage.
And, here you can learn more about financial leverage.
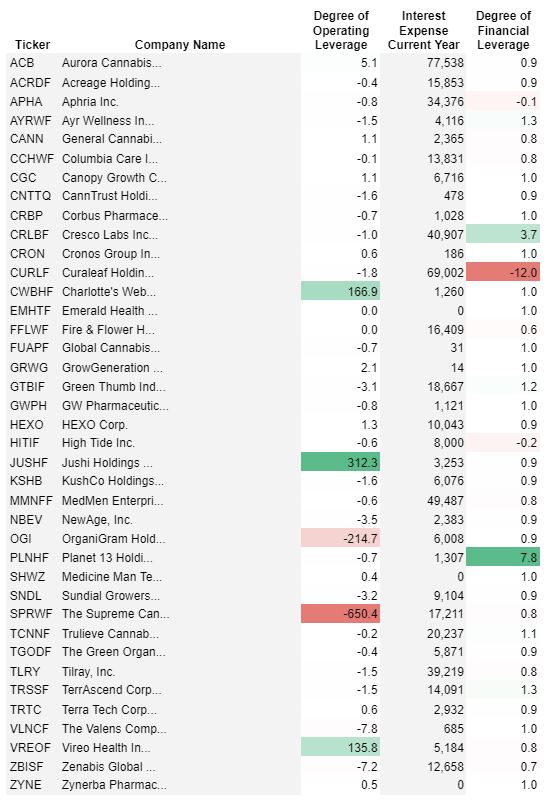
Degree of Operating Leverage (DOL) compares changes in Operating Profit to changes in Annual Revenue. For example, if a company has a DOL of 1.3, then a 70% increase in Revenue would be expected to result in a 91% increase in Operating Profit (70% × 1.3). The reverse is also true. A 70% decrease in Revenue would be expected to result in a 91% decrease in Operating Profit (-70% × 1.3)!
Degree of Financial Leverage (DFL) looks at changes in Operating Profit and Interest Expense. For example, if a company has a DFL of 1.3, then a 30% increase in Operating Profit would be expected to result in a 39% increase in Net Profit (30% × 1.3). Again, the reverse is also true. A 30% decrease in Operating Profit would be expected to result in a 39% decrease in Net Profit (-30% × 1.3)!
Here’s where you can find out more about leverage; plus other useful ratios.
Reasons to avoid marijuana stocks
Cannabis stocks excite investors because they feel that this industry has the potential for a lot of growth. While that certainly appears to be the case, there are always risks that must be considered when making any investment.
What if we’re already at, or near, the cap of states/jurisdictions that will legalize marijuana? What if, in the U.S., the federal government decides to step in to enforce its position on this drug?
As shown in the tables above, there is a lot of competition in the cannabis industry. Eventually, it can be assumed that 20% (or so) of the companies will control 80% of the market. Which companies it will be is difficult to determine, however. Perhaps it’s a company that hasn’t yet been created, or hasn’t yet gone public?
Consider also, before you invest in a cannabis stock, how many shares the company is issuing year after year. We might assume that these shares are being issued to fund growth (and secure market share). However, the incessant issuance of additional shares could dilute your ownership stake in the cannabis company you choose to invest in.
Profitability is also a concern. While revenue might grow considerably over the coming years and decades, as of now, none of the pot companies are able to convert much revenue into net income.