Product growth potential involves performing analyses that determine if a company has “products or services with the potential to make possible a sizable increase in sales for at least several years.” One of the steps in determining this is to estimate the market size and growth potential of the company. Two ways to estimate the (serviceable obtainable market) SOM is through a top-down analysis and bottom-up analysis.
Most of the posts on InvestSomeMoney.com, thus far, has been geared towards the technical analysis side of things. This post is for those investors who prefer to perform fundamental analysis.
This is the first post in a series that will cover topics related to the fundamental analysis of stocks. These posts will take their inspiration from the book Common Stocks and Uncommon Profits by Philip Fisher.

The central theme of CS&UP is Fisher’s “fifteen points.” These points highlight attributes which Fisher
Point number one, from Philip Fisher’s fifteen points, is to discover if a company has products (or services) with the potential to increase in sales for several years. So, I’ll kick off the posts on fundamental analysis by trying to answer the question – “What is product growth potential?”
Two ways to estimate market size and growth potential
Estimating the size of the market (and its growth potential) for a company’s products and/or services is a necessary step towards determining if there’s potential for their products and services to increase in sales. If a company has already reached the threshold of the market that it can realistically be expected to serve, then there’s no room for growth. There have to be potential customers, that are as of yet unreached, in order to grow.
Market size can be gauged by determining the number of units sold or people served. Ultimately, though, the value of that market in terms of dollars needs to be estimated. Also important, is to get a rough idea of whether that market is growing or shrinking, and if so, how much.
There are two broadly accepted methods for ascertaining the size of a company’s market: top-down and bottom-up.
The example company – Foot Locker
Below, I’ll give examples of my first stab at a top-down and bottom-up market analysis. I decided to use Foot Locker as my example company. Like most people, I’m familiar with Foot Locker, but not an expert on retail in general, or fashion athletic apparel, specifically.
I’ll walk you through my line of thinking and how I arrived at the conclusions that I did. This is by no means the only rational way to approach a top-down or bottom-up analysis. But it’s the way I decided to approach it.
In this day and age, there are lots of good resources available for research of this sort. Nevertheless, you are probably not going to arrive at a completely accurate figure. The market potential for a given company is, in large part, an educated guess. An educated guess is better than a wild-ass guess. Not every piece of information you would like to have is going to be available. And, at a certain point, the cost and benefits of your research need to be taken into consideration.
Top-down market sizing
The top-down method for estimating market size starts with a large population. Maybe even the entire population. From this population, you then apply filters to narrow down the market into a total addressable market (TAM), a serviceable available market (SAM), and a serviceable obtainable market (SOM). The last of these being the final estimate of a
The variables that you use for filters will vary depending on the industry you’re examining and the availability of information. All of the information I used was free and available online after a decent amount of digging. Links are included as references.
Credit for the concepts of TAM, SAM, and SOM goes here.
Total Addressable Market (TAM)
To begin with, I didn’t look at the entire population of the earth. Rather I looked at the total dollars spent within a particular market. For instance, the total apparel industry is estimated at 3 trillion dollars worldwide.
Foot Locker, however, doesn’t sell every type of fashion. The brands owned by Foot Locker, Inc., only sell sports apparel. The sports apparel industry is only a fraction of the total apparel industry. It’s estimated size is 177 billion dollars for 2019. I worked backward from this link, to arrive at that figure.
Serviceable Available Market (SAM)
Okay, so we’ve narrowed things down a little bit. Now, though, the analysis is going to get a bit more subjective. Personally, I would consider Foot Locker to be a unique sort of sports apparel retailer. From the few times I’ve actually been in a Foot Locker store (and from what I can kind of pick up from their website), they s seem to have positioned themselves as what I’ll refer to as a “fashion” sports apparel retailer.

Different types of sports apparel
Some sports apparel retailers sell clothes and shoes designed more for functional use. I’m thinking of the DICK’S Sporting Goods, Academy Sports + Outdoors, and even the
So, if we look at this link, we can get an idea of the biggest sporting goods, footwear, and apparel retailers in the U.S. The total of the companies listed in the graph is 59.25 billion dollars in sales. This represents a big chunk of the $177 billion sports apparel industry. Of this $59.25 billion, I would consider Foot Locker and Champs Sports (since they’re both Foot Locker brands) to be included in the Serviceable Attainable Market (SAM). Additionally, I would include Finish Line and Fanatics in the “fashion” sports apparel niche.
If we take the total sales for those four stores we get 6.15 billion dollars. $6.15 billion ÷ $59 billion = 10.5%, give or take. This tells me that, roughly, the “fashion” sports apparel niche is equal to roughly 10.5% of the total sports apparel industry. We know that the sports apparel industry, as a whole, is $177 billion. If we take 10.5% × $177 billion we are left with approximately $18.6 billion. This is my estimate for the SAM.
Serviceable Obtainable Market (SOM)
Finally, we want to look at the Serviceable Obtainable Market (SOM). It’s unlikely that any single company will ever capture 100% of the SAM. What’s a realistic max percentage to hope to capture? I’m going to use the Pareto Principle and estimate 80%. A company can’t be everything to everyone. If Foot Locker were to ever get 80% market share, there would still be plenty of retailers that catered to customers that Foot Locker could not reach.
With that 80% figure in mind for the SOM, we are left with an estimated market for Foot Locker of 14.9 billion dollars (80% × $18.6 billion). Right now, as of 2017, their sales are $7.8 billion. Or, put another way, 42% of their potential market.
So, there we have it. An e
Bottom-up market sizing approach
As you probably guessed, a bottom-up market analysis is the opposite of a top-down. With a bottom-up market analysis, you start with a person (or a segment of the population) and continue to add people until you feel you’ve included everyone who could conceivably be a customer.
Just as with the top-down analysis, you’re going to have to work with the information you have available. In theory, you could use demographic information from the census and simply add up all the segments of the population that the company you were analyzing would serve. In reality, it probably won’t be that simple.
What’s important is that you attack this market sizing problem from a different direction than you did previously. If you end up with a similar figure then you can at least have some confidence that it’s somewhere close to accurate. Because – you arrived at that same number from two different ways of thinking.
Again, all of these estimates will be subjective. You’re going to have to probably use some creativity when performing this analysis.
An analysis for each business segment
For Foot Locker, I had to approach their two different business segments in different manners. Those two segments are athletic stores and
Athletic stores segment
Starting with the athletic stores segment, I looked at per-store sales. With 6.7 billion dollars in total segment sales and 3,310 stores, the per-store average is roughly 2 million dollars. If the average store has revenue of 2 million dollars, then I knew I needed to figure out a way to estimate how many stores the market could support.
I used this information regarding the population of metropolitan areas from Wikipedia. I won’t walk you through every single thought process I had when arriving at the following conclusion. In part, because it’s not necessary. Also, because I don’t remember.
Nevertheless, comparing these population figures with what I found on the Foot Locker “store locator” page, I estimated that for every 150,000 in population, one of Foot Locker’s stores could be supported. Keep in mind that a Foot Locker store, per se, might not work for every 150,000 people. But, one of their other existing storefronts or an as-of-yet unconceived storefront might work.
This might seem like a stretch at first glance. But, if you look at some of the metropolitan areas listed on the Wikipedia page and look them up on the store locator you’ll find that there are several towns with less than 100,000 people that support a Foot Locker store. So, the notion that 50% more people couldn’t support a store doesn’t seem reasonable.
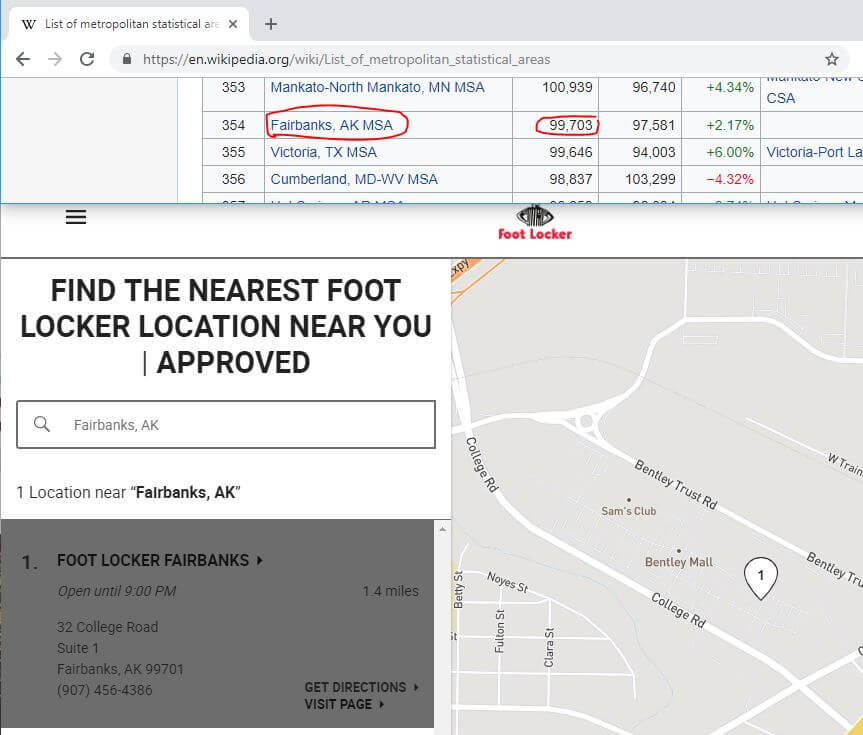
Also keep in mind that there is, needless to say, a floor for the amount of population that could support a store. For instance, a town in western Kansas, with 2,000 people, couldn’t support a Foot Locker store. Even if the entire population of western Kansas is in excess of 100,000 people.
In the U.S.
With this information, I ascertained what percentage of the population lived in cities that met that “minimum” of 150,000 people. 268 million people live in cities with a population of at least 150,000. 268 million ÷ 326 million (the current population of the United States) = 82.2%.
So what does that percentage tell us? It says that 82.2% of the population lives in a city that big enough for at least one Foot Locker store. We’ll keep that in mind when we try to determine how many stores would be practical internationally.
As far as the U.S. is concerned – if every 150,000 people can support one Foot Locker, then we’ll take 268 million ÷ 150,000. That equals 1,787 potential stores in the United States. According to Foot Locker’s 10K, as of February 3rd, 2018, they had 2,172 stores across all brand names in the United States. Well, that’s quite a bit more than I estimated they would need. Perhaps that’s why they closed 147 stores worldwide in 2017?
Growth in brick and mortar retail in the United States, for Foot Locker, is probably maxed out for the immediate future. I wouldn’t think that it will exceed inflation by much. However, if we take some of the metrics calculated the United States and apply them in Foot Locker’s other markets there might be some opportunity for growth.
Internationally
Foot Locker “Store Profile” (from the 10K) tells us that in addition to the United States they also have stores in Europe, Canada, and the Asia-Pacific region. For Europe and Canada I looked at the total population, took it times 80% (a touch more conservative than the 82.2% of the population calculated in the United States example) and divided that amount by 150,000 to get a rough estimate of the number of stores that Foot Locker brands might be able to justify in those markets.
But what about the Asia-Pacific region? Since I figured it might not be practical to include the entire populations of India and China in my analysis, I simply excluded them and stuck with developed countries. These included Singapore, Japan, and Australia. I won’t walk you through all of the math for each country; the same general formula was used.
With an idea of how many stores a geographical area could support, based on the population and the percentage of that population that lived in a city with at least 150,000 people, all I had to do was take the store numbers × the average revenue per store of $2,000,000. When all was said and done I calculated $10 billion in potential revenue internationally. That was added to the $3.6 billion in the U.S. The total, was, of course, 13.6 billion dollars. This, as of today, is what I see as the maximum potential revenue for the brick and mortar segments of the business.
Direct-to-customer segment
That leaves the direct-to-customer online/catalog sales to be estimated. This presented a little more of a challenge than the athletic
Website traffic
I toyed with several different ways of estimating their potential market for the direct-to-customer segment. Ultimately I decided to look at the traffic to each of their websites (footlocker.com, ladyfootlocker.com, champssports.com, and so on). I used an extension for Chrome called SimilarWeb. It’s not a precise measurement, but I figured they probably knew better than I did.
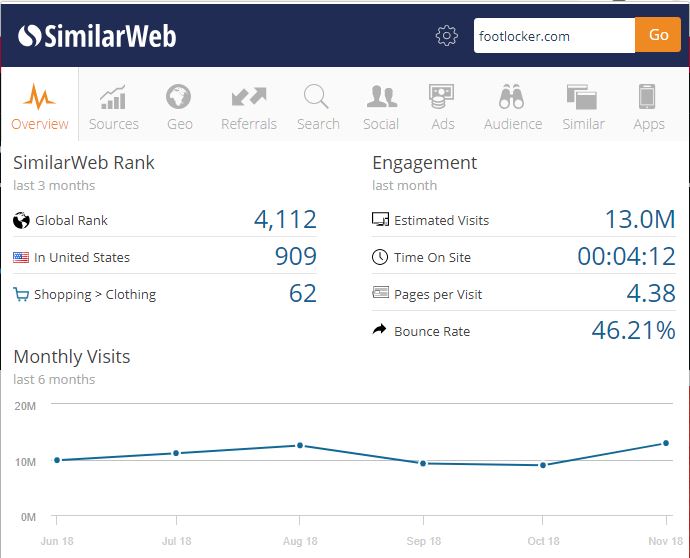
The total visits for all of their sites, over the course of a month, was estimated at 22.1 million. That’s fine and good, but how many people actually purchase and how much do they spend?
The average conversion rate for the apparel, footwear industry is approximately 11%. Or at least it was in 2014.
Average sale price
The average sale price was a little more difficult to estimate. Ultimately I settled on a very unscientific approach. I simply went on the footlocker.com top sellers page and took a quick sample of the price of those items and calculated an average.
My estimate of the average sale was $170. Granted, some people might buy more than one item. Also, the “best sellers” might be something of a marketing ploy by Foot Locker to push sales for particular items. Nevertheless, I didn’t have much to work with here so I had to take my best guess.
Orders per year and conversion rate
If the average sale is truely $170, and the direct-to-customer segment does $1.1 billion in sales every year, then that would mean that they fulfill approximately 6.5 million orders every year. As a feasibility check, I did a quick google search on the number of orders amazon.com fulfills in a year. The number I got was around 1.1 billion. Obviously, significantly more than I estimated for footlocker.com. It doesn’t mean my number’s right, but if it were close to what Amazon did, I would know that I was way off.
If we assume that 6.5 million orders per year is in the right neighborhood, then we divide that amount by the 265 million visits per year (22.1 million × 12 months). That gives us an estimated conversion rate of about 2.5%. This is in line with the average global conversion rate, but well below the apparel, footwear and accessories conversion rate of 11%.
Meaning – if Foot Locker increased its conversion rate to the industry average, this would translate into about four and a half times as many online sales as they make now. If you do the math, that translates into $4.9 billion per year in direct-to-customer sales, versus the $1.1 billion they do now.
Compiling the data
Okay, so we know there’s a lot of room for growth internationally for the athletic stores segment. There’s also plenty of room for improvement on the direct-to-customer side of the business. I estimated the total market for athletic stores to be $13.6 billion. The total market for the direct-to-customer was estimated at $4.9 billion. That makes for a grand total of $18.5 billion.
The bottom-up analysis came to the conclusion of a bigger potential market than the top-down did. Admittedly, I haven’t done a lot of these but it’s my impression that that’s unusual. From what I’ve read, usually, the bottom-up analysis is more conservative. So, I suppose it might be prudent to move forward under the assumption that the more conservative estimate, the top-down, is the more accurate one. It might be that the growth of athletic stores, plus more online sales, could cannibalize some of the potential market for Foot Locker. In fact, this would be almost impossible to avoid. Which makes the smaller, top-down estimate, all the more appealing.
No matter how you cut it, with $7.8 billion in sales currently, there is still room for Foot Locker to grow. Potentially to double.
Online and brick-and-mortar retail growth
Okay. Now we have a vague idea of the potential market size for Foot Locker. What about growth?
Here, we can see that retail e-commerce growth is expected to slow in the coming years. However, at nearly 20% annually, it’s still growing at a very aggressive rate.
This site says that online retail is expected to grow 8x more than brick-and-mortar. If that’s the case, then a 20% average growth rate for online retail would translate into roughly a 2.5% growth rate for brick-and-mortar retail.
Market size & growth
Foot Locker doesn’t seem to be pushing the boundaries of its potential market. The markets it operates in continue to grow, too. From this standpoint, the market potential exists for Foot Locker to realize a substantial increase in sales.
Before we get too excited, however, keep in mind that Fisher outlined fifteen points to consider when evaluating a potential investment. Not just one. Beyond that, operating in a market that has a lot of potential is one thing. Exploiting that opportunity is another.
In coming posts, I’ll examine some other things to consider beyond market size and growth. Those include:
Do you agree with my projections in the top-down and bottom-up analysis? Did I overlook or misestimate anything?
How would you have attacked this analysis?
If you have valuable feedback, join the conversation on Twitter!