A valuation spreadsheet is a model of a company’s future performance. It allows you to estimate the current value of that company’s stock. With this information, you can formulate an opinion as to whether a company’s stock is over, under, or fairly valued.
If you understand the company and are good at forecasting the future, you can make investments based on your analyses. Potentially, you could make a lot of money.
The stock valuation spreadsheet download/walkthrough begins about 1/3 of the way down the page.
Looking to diversify your investments? Read this post:
INVEST MONEY TO MAKE MONEY (SLOW?) – 4 TRIED-AND-TRUE WAYS
Download the Valuation Spreadsheet
Don’t really want to know how to create a stock analysis spreadsheet? Just want to use a stock analysis spreadsheet?
Use the very one I reference in this post. Download it into Excel and tweak it as you see fit.
Complete the form below and click Submit.
A link to the Google Sheet will be emailed to you.
Once you’re in the spreadsheet, click on File > Make a copy to edit. I’ll no longer be responding to “Requests for access.”
The inspiration for this model
This workbook is based on Martin Shkreli’s Finance Lessons on YouTube. These lessons have since been removed from that platform. If you’d like to watch them, follow this link.
Understanding the valuation spreadsheet
Any spreadsheet software will work if you want to follow along. All of the formulas used should be the same.
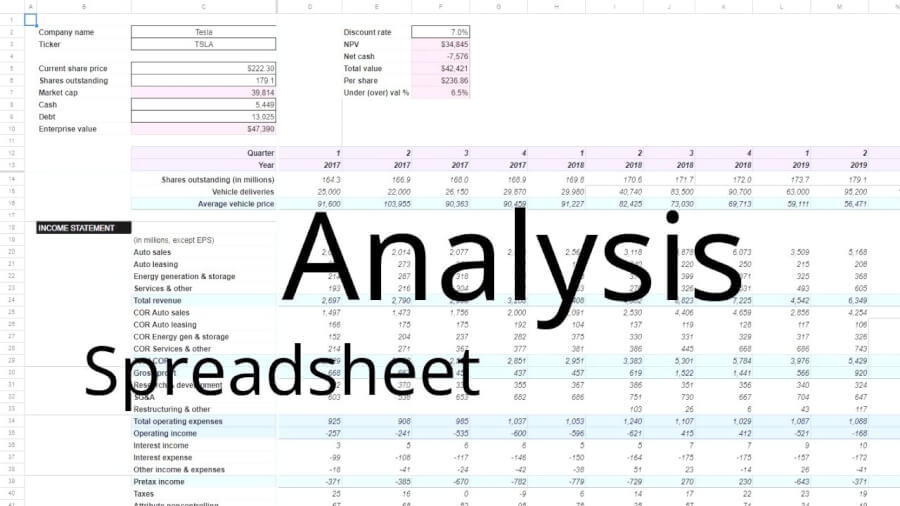
In this tutorial, I’ll be creating a stock analysis spreadsheet for Tesla, Inc. (TSLA). This is not a company I was terribly familiar with prior to creating this example. But, you learn a lot about the company you’re analyzing when you go through this exercise. Nevertheless, I understand that some of my assumptions might be misinformed. Over time, if someone continued to analyze Tesla and update their model, I would imagine that they would become very familiar with the company. Maybe more so than a lot of the employees!
Before we get too deep into it – let’s clear something up.
I only used Tesla as an example in this stock analysis spreadsheet. A company to fill-in-the-blanks, so to speak. Admittedly, I didn’t do enough “scuttlebutt” to fully stand behind my valuation of them.
So, don’t take this as an endorsement of any firm position on the true value of Tesla’s stock.
Start with the basics
We’ll start out with some basic information about the company we’re analyzing.
In cells B2 through B10, enter the following:
“Company name”
“Ticker”
[leave cell B4 blank]
“Current share price”
“Shares outstanding”
“Market cap”
“Cash”
“Debt”
“Enterprise value”
Some of these terms might seem obvious, others might not. One (Enterprise value) might be completely foreign to you.
I like to add a bit of formatting to my models. It makes them more readable, in my opinion. On most of my other spreadsheets, you’ll notice that I leave the variables (inputs) white, and format the field and row names, plus the formulas. This makes it obvious what should (not) be changed.
If you’re following along, you’re welcome to format however you see fit.
So, I’ll make the text in B4:B10 bold and color the cells gray.
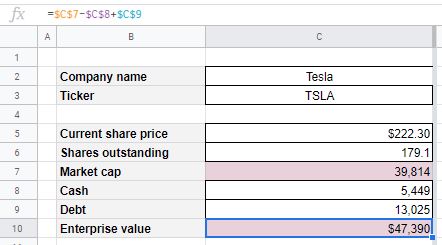
Only two of these fields will be formulas – Market cap and Enterprise value.
Market cap = Current share price × Shares outstanding
So, in cell C7, enter “=C5*C6”.
Keep in mind that in this walk-through, big numbers will be expressed in millions for the sake of readability. For example, 179,127,239 (Shares outstanding) will be represented as 179.1. The same will hold true for almost all of the numbers reflected in the financial statements.
What the heck is Enterprise value anyways?
Enterprise value and Net cash are two terms that Martin Shkreli uses quite often. I haven’t seen these concepts used elsewhere (not to say they haven’t), but they are actually quite intuitive.
Net cash = Cash – Debt
Cash can include anything that is highly liquid, like marketable securities or other equivalents. Inventory and Accounts receivable would not be included. Debt includes short and long-term borrowings.
Enterprise value = Market cap – Net cash
The best way I can think to describe Enterprise value is that it’s the total amount it would take to have complete control of the company.
As usual, looking at extreme examples can help with understanding.
If a company had a Market cap of $1 billion, $1 billion in Cash, and $0 in Debt ($1 billion Net cash) then its Enterprise value would be $0. Why? Because if you purchased all the shares for $1 billion, you would immediately become the owner of its $1 billion in Cash. In essence, getting a refund of the purchase price. Net money out of your pocket = $0.
If we flip that example on its head – we have a company with $0 Cash and $1 billion in Debt. In this case, after you bought the company for $1 billion, you would have the obligation to pay another $1 billion in Debt. Hence, an Enterprise value of $2 billion.
So, in cell C10, enter “=C7-C8+C9”.
When you are done, you should have something like this:
Calculating enterprise value for Tesla
The Current share price is, of course, easy enough to find.
Shares outstanding, Cash, and Debt will come from the company’s latest SEC filing (10-K or 10-Q).
For Tesla, I used Cash & equivalents and Restricted cash (noncurrent) to come up with my Cash amount.
Current LT debt, Current promissory notes, and Long-term debt were included in the Debt amount.
Quarters, years, and financial statement lines
Now, we’ll get our rows and columns set up and ready for data input.
Valuing a company depends on making forecasts for the future. In order to forecast the future, we’re going to want a bit of history to reference. No, the past won’t tell us exactly what will happen in the future. But, it will give us a good starting point.
The accompanying Tesla model was created in August of 2019. So, I went back and referenced every quarter through 2017. Q3 and Q4 of 2019 were forecasted because those results had not yet been reported.
Additionally, for yearly results, I went back to 2016.
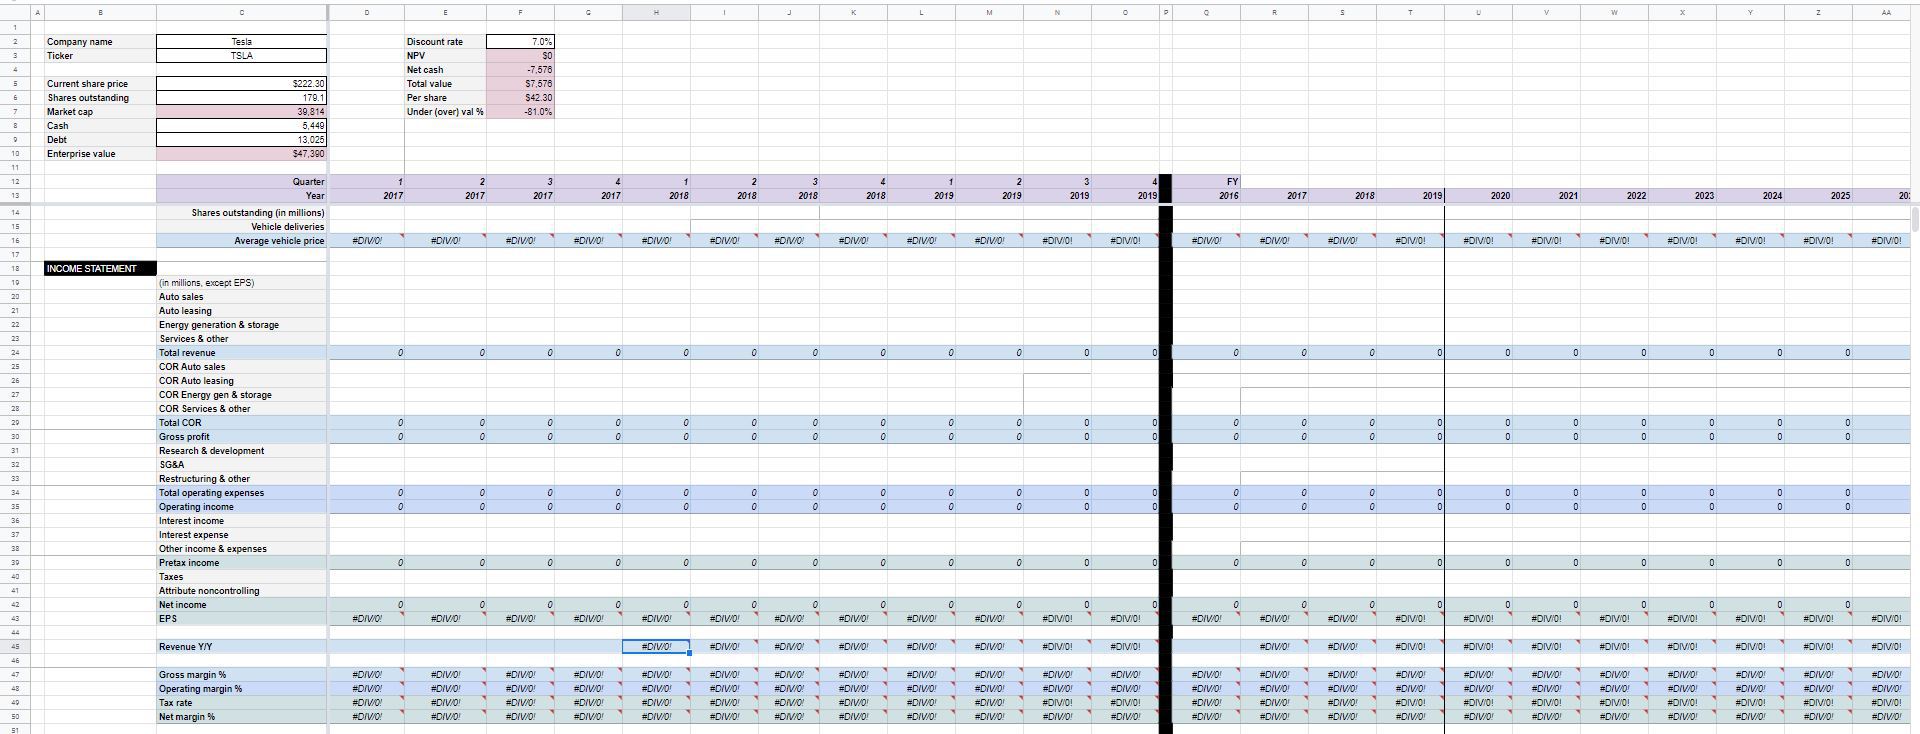
In cells C12 and C13, enter “Quarter” and “Year” respectively. After that, you’ll have to enter the corresponding quarter (1-4) and year depending on when you’re conducting this analysis and when your company ends its fiscal years and quarters.
Also, for good measure, I’d recommend freezing the panes below row 13 and to the right of column C. This will make the model easier to read as you scroll down and to the right.
Below is, roughly, what your spreadsheet should look like now.

How far to forecast into the future?
In theory, a company could provide returns in perpetuity (forever). Therefore, you should calculate the Net Present Value (NPV) of the company accordingly.
Here are some things to consider, though. First, you won’t live forever. Not only that, you’ll probably want to reap the rewards of this well-researched investment well before you die.
Another thing to consider, in my opinion, is what’s known as the Lindy effect. This concept states that the future life expectancy of something is roughly the same as its age. In essence, the longer a company has been around, the longer you can expect it to be around in the future.
Forecasts are usually wrong as it is. Beyond fifteen years, you’d have to be Nostradamus to have any prayer of being accurate.
But, that doesn’t mean that earnings end after fifteen years. Or, that you’ll not hold this stock beyond fifteen years. So, while the forecasts might end there, you’ll still project earnings out further (usually).
This is referred to as the “terminal value.” These earnings can be flat, increase by 1-2% to reflect inflation, or decline by a few percent to reflect the company’s maturity and decline.
The call is yours. It’s important to include these amounts however because they will play an important part in valuation.
How far did I forecast for Tesla?
Hopefully, you see the implications of the Lindy effect for a company such as Tesla. Nearly everybody praises Tesla for its innovation and assumes that they’ll be around forever. The reality is, though, they are still a very young company. They might be around forever. But, it will take withstanding the test of time to prove that.
So, in accordance with the Lindy effect, I only forecasted Tesla’s earnings for thirteen years. They were founded in 2003 (thirteen years ago), so that’s how far I went out. Needless to say, I did not include a terminal value for them.
Maybe you disagree and think that Tesla will be around a lot longer than that. That’s great. You can reflect as much in your model.
A couple of accompanying fields
First and foremost, we’ll need to know the number of Shares outstanding to calculate earnings per share (EPS) for the past and to project it into the future. Like most of the data in this spreadsheet, I would suggest that you enter this information in millions – for the sake of readability.
This area is also a great place to include additional complementary information. What information to include here will depend on the company you’re analyzing. You could put segment revenues, active user amounts, or anything else that can help you forecast overall sales.
For my Tesla analysis, I included Vehicle deliveries and a calculated field to determine the Average vehicle price.
The income statement
This is ultimately where the value will be calculated from, so we’ll put it up at the top.
Sure, the basic components of every company’s financial statements are going to be the same. Revenue, cost of revenue, net income, assets, liabilities, and so on… However, for this analysis, I recommend breaking it down into the same amount of detail as the company does in their SEC filings.
Is the company you’re analyzing turning leads into repeat business? Read this post:
CONVERSION FUNNEL ANALYSIS – WHAT’S IT MEAN FOR INVESTORS?
Looking at the financial statements in detail will help us to better understand the company and to make more informed forecasts.
The downside? This information (as far as I know) has to be manually typed in.
Click to enlarge
Why do we manually type financial statement data in?
Yahoo! Finance, and similar websites, will have financial statements for all publicly traded companies, sure.
But they probably won’t go back in time as far as you need. They also won’t have the amount of detail you need to make a thorough analysis. Every company’s financial statements will be displayed in the same generic manner. It doesn’t matter if they manufacture cars, are cannabis retailers, or make consumer goods.
So, we’re left to type this information in manually. Which is exactly what Martin Shkreli recommends. He says it gives you a “feel for the business.”
He’s right, to a certain extent. Having done this, I do think that I got my finger on the pulse of Tesla’s business better than I would have if I just imported the numbers.
But…
This is a time-consuming process. Not just the typing of historical information, but the forecasting, revising, and forecasting (again and again). The bitch of it all is, most of the time all this effort won’t pay off. Martin, himself, estimates that only 1 in 10 companies analyzed are investment-worthy. So, it seems to me that it would be prudent to save time where possible.
How, though? Good question. I’m certain that some viable method exists to import this information. XBRL or something similar? I don’t know, I haven’t found that viable method yet.
So, for now, we’re left to enter this information manually. Don’t worry, you get faster the more you do it.
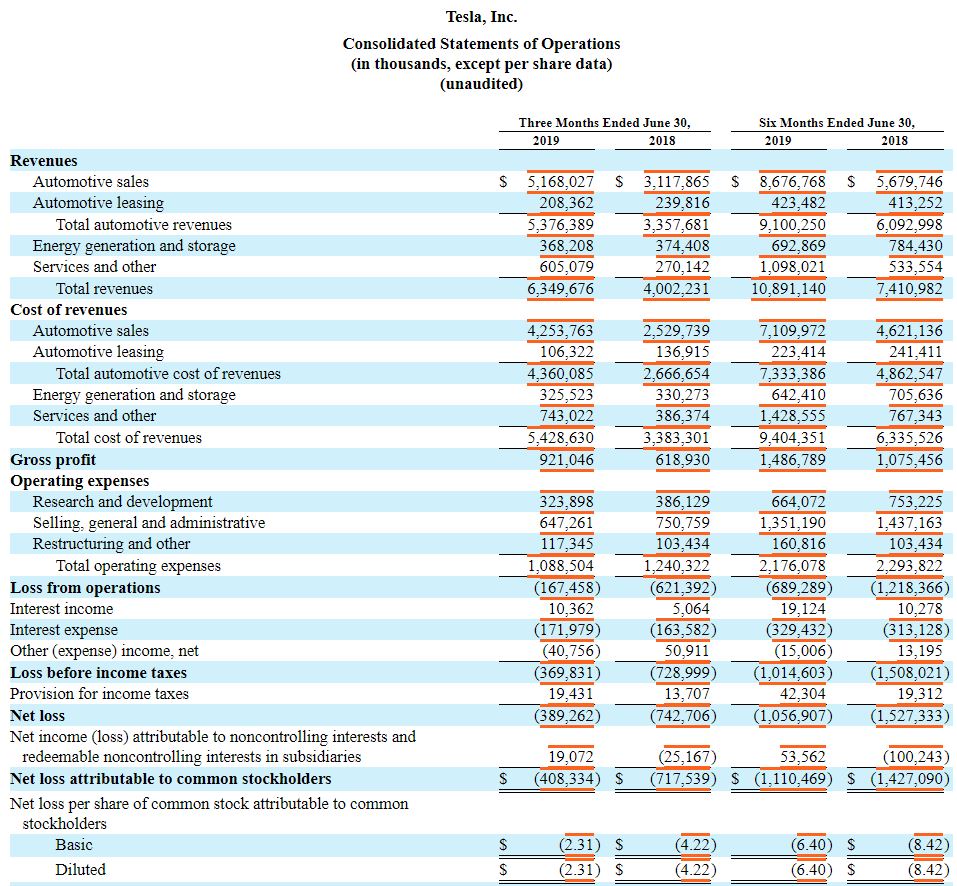
Back to the income statement
Tesla, on its income statement, breaks revenue down into four categories. It also breaks the cost of revenue down into the same categories.
Auto sales are, by far, their biggest source of revenue. But, as I said above, it’s just easier to make fields for every line in the income statement rather than trying to group them together. It makes it easier to find errors and check your totals.
So, we will be copying amounts directly from the company’s SEC filings. But, we also want to be able to check our work.
How do we do that? By making our own subtotals and comparing them with those in the SEC filings.
Make a subtotal for Total revenue (if necessary), Total COR (also if necessary), Gross profit, Total operating expenses, Operating income, Pretax income, Net income, and EPS. I’d give you the exact formula to enter, but it will vary from company to company.
Once you create a subtotal for your first historical quarter, you can copy that formula across for all quarters and years.
Do keep in mind that since we are rounding to millions of dollars, our subtotals might not be exactly the same as what’s in the SEC filings. That’s fine, it won’t hurt anything. It’s only if we’re way off that we need to double-check what was entered in the stock analysis spreadsheet.
Additional formulas for the income statement
To aid with our forecasting into the future, it will be helpful to know about some percentages from the past.
Specifically, Gross margin %, Operating margin %, Tax rate %, and Net margin %.
Again, I can’t tell you specifically what rows/cells to reference. Here are the calculations for each:
Gross margin % = Gross profit ÷ Total revenue. In my spreadsheet, this is row 30 ÷ row 24.
Operating margin % = Operating income ÷ Total revenue. In my spreadsheet, this is row 35 ÷ row 24.
Tax rate % = Taxes ÷ Pretax income. In my spreadsheet, this is row 30 ÷ row 29.
Net margin % = Net income ÷ Total revenue. In my spreadsheet, this row 42 ÷ row 24.
Would you like to learn more about margins and what drives them? Read this post:
PROFIT MARGIN ANALYSIS OF STOCKS – GROSS, OPERATING, & NET, THE EFFECTS OF LEVERAGE
There is one more formula to enter for income statement analysis. It is Revenue Y/Y (year over year).
Revenue Y/Y is Total revenue for the quarter ÷ Total revenue for the same quarter in the previous year – 1. Subtracting 1 gives us the percentage change. Which is what we’re after.
In my spreadsheet, the formula for Q1 2018 is “=H24/D24-1”.
When all of that is done, you should have something that looks kind of like this:
The balance sheet and cash flow statement
The same principles apply for these two financial statements that did for the income statement. I suggest you enter every line item from your company’s SEC filings.
I also suggest you create subtotals to check against the SEC filings.
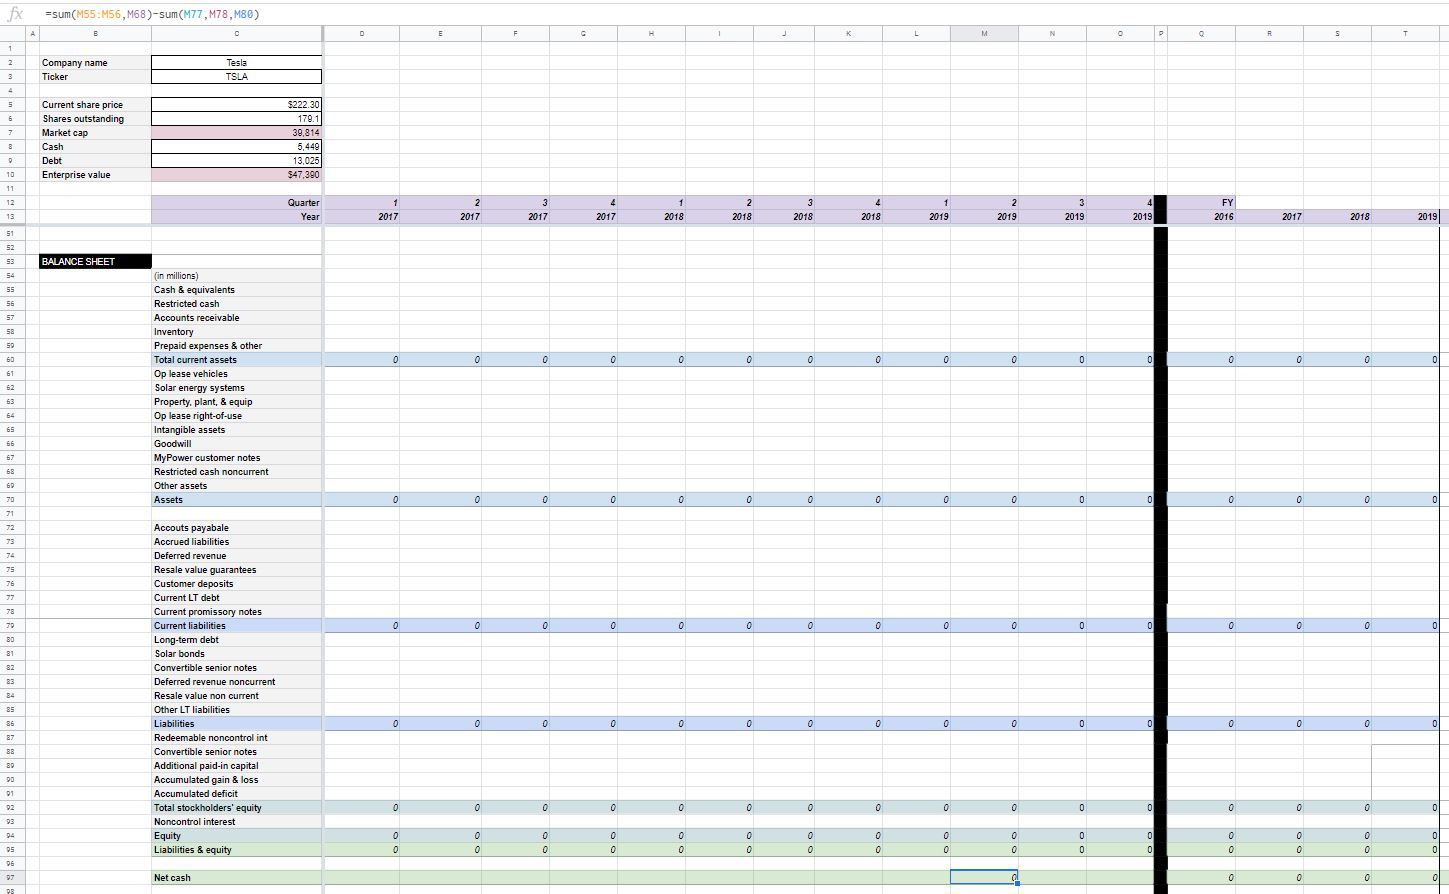
On the balance sheet, I would create subtotals for Total current assets, Assets, Current liabilities, Equity, and Liabilities & equity.
For Tesla, I had to include an additional subtotal – Total stockholder’s equity because the distinction was made on their balance sheet. You may not have to do the same.
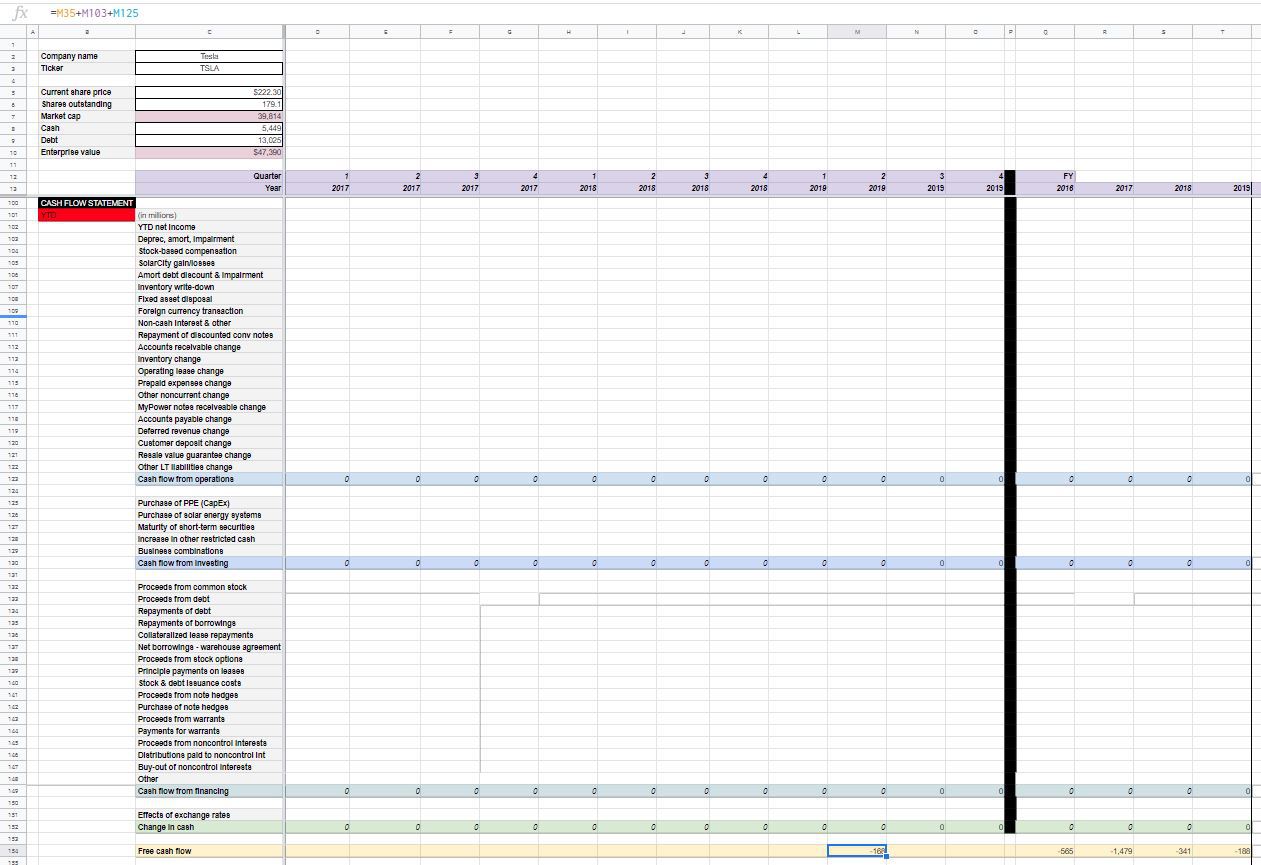
As far as the cash flow statement goes, I would create subtotals for Cash flow from operations, Cash flow from investing, and Cash flow from financing, and Change in cash.
Format the field names and formulas if you wish.
Additional formulas for the balance sheet and cash flow statement
For the balance sheet, I would include a formula that calculates Net cash.
As a reminder:
Net cash = Cash – Debt. In my spreadsheet, this is row 55 + row 56 + row 68 – row 77 – row 78 – row 80.
Below the cash flow statement, I’d also include a formula for Free cash flow.
Free cash flow is another way to look at the earnings of a company. The theory behind this calculation is that it can’t be as easily manipulated as some other measure of profitability. Therefore, it is a better representation of a company’s earnings. Free cash flow should approximate earnings over a long enough time period.
Free cash flow can be calculated in many different ways. Here, we keep it simple:
Free cash flow = Operating income (from the income statement) + Depreciation, amortization, and impairment – Purchase of Property, Plant, and Equipment (aka CapEx). In my spreadsheet, this is row 35 + row 103 + row 125 (CapEx is a negative number).
Here’s how the balance sheet looks:
And, the cash flow statement:
How to create a stock analysis spreadsheet without entering any data!
Just kidding.
That can’t be done – as far as I know. The foundation is laid, but now comes the time-consuming part.
First and foremost, go to the SEC Company Search Page, here. Enter your ticker symbol into the Fast Search field.
For the income statement, you’ll want to enter information for every quarter and fiscal year up to the present. Quarterly (the first three) can be found in the 10-Q. Yearly information can be found in the 10-K.
Information for the last quarter of the year is a bit trickier. It can be found in the 8-K filed near the same time as the 10-K. You might need to click on the Next 40 button at the bottom of the page to find it.
What you’re looking for is a form titled Results of Operations and Financial Condition.
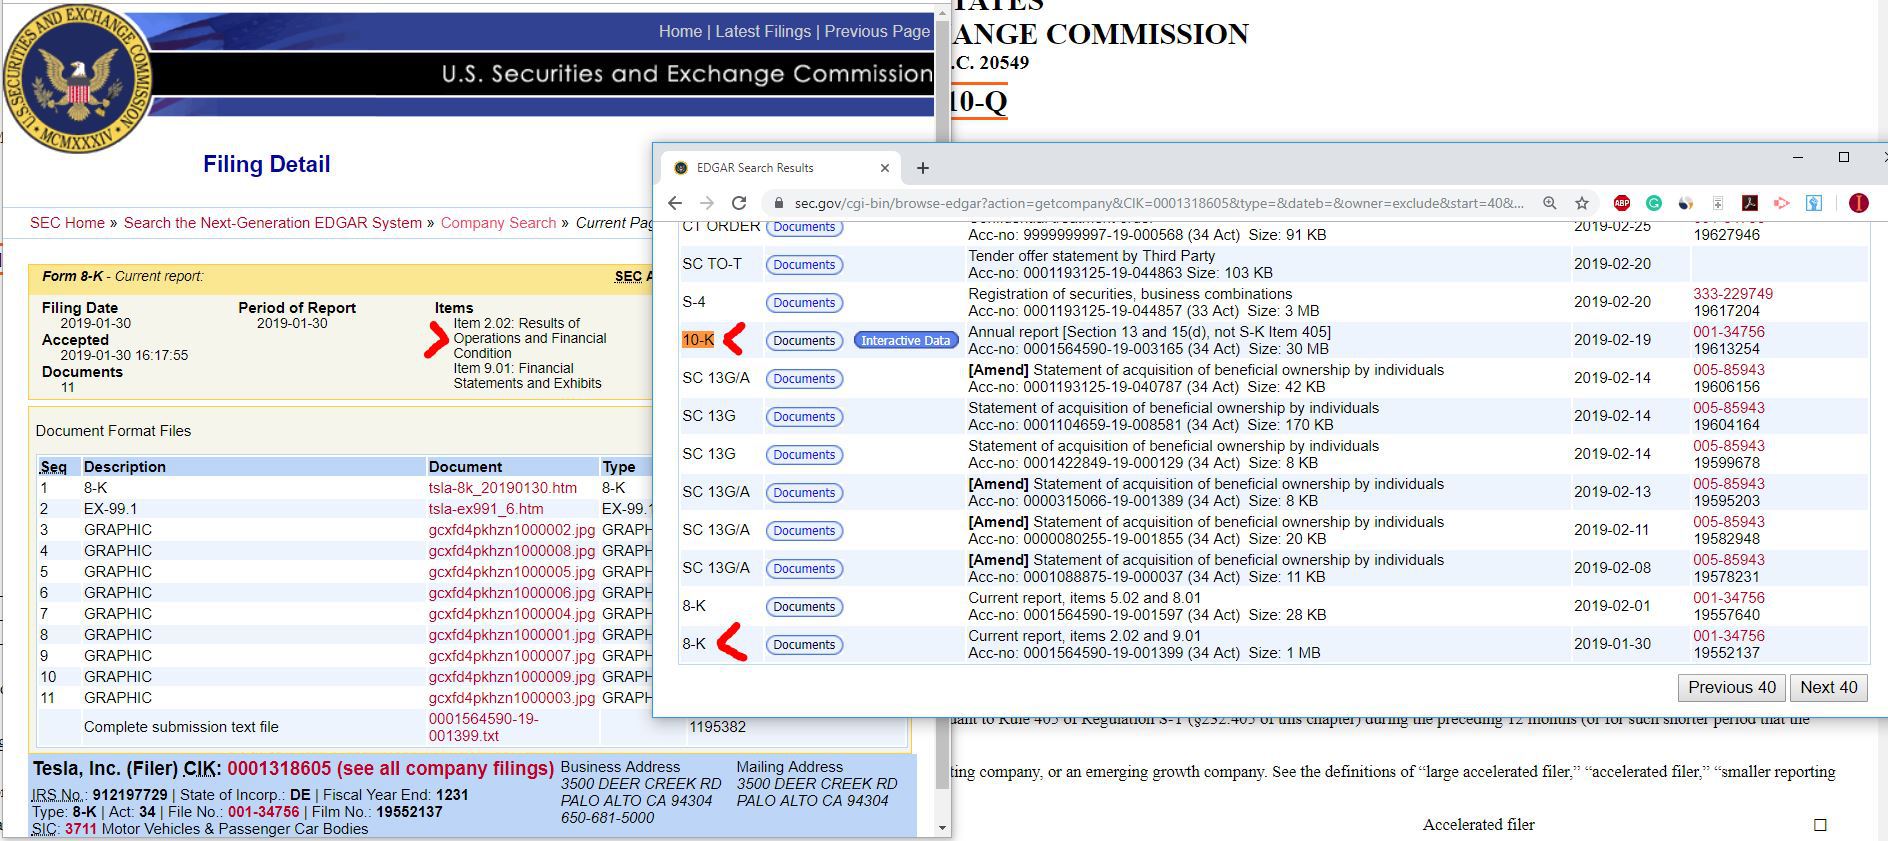
Click to enlarge
As far as the balance sheet and cash flow statement go, how many periods to enter is up to you.
You can certainly enter it for every quarter. Personally, for the sake of time, I just enter it for every fiscal year and the most recent quarter (assuming it isn’t Q4).
Once we have the historical information we need, it’s time for the fun part. Time to forecast into the future.
Forecasting future earnings
I wish I knew of a fool-proof way to predict the future. But, I don’t.
There is no one way to go about this. You can, however, lean on the extensive information you entered previously.
Each section of the income statement will have to be judged independently.
Don’t expect to get this done in one pass. As you address certain fields, you’ll have thoughts about others and you’ll have to circle around to adjust them. Just keep playing with it and you should settle on a forecast that you’re comfortable with, eventually.
For some companies (Tesla) Shares outstanding shows a pretty consistent trend. If that’s the case, forecasting should be pretty easy.
Keep in mind that as a company matures, cash balances grow, and investment opportunities dry up. In these cases, they might get aggressive with share buybacks.
On the other hand, all companies rely, to some extent, on stock options as a form of compensation – particularly young ones. Think about EPS. If you forecast that it will increase, then the likelihood of options getting exercised increases. If EPS is flat, they may not.
As far as fields such as units sold and average price – those are industry-specific. You’ll have to rely on your knowledge of the company and its industry to make an educated forecast there.
Revenue
What has their Revenue Y/Y been on a quarterly and yearly basis? Unless something drastic happens, it probably won’t change course drastically.
Keep in mind the various stages of the business cycle, though. The aggressive growth that a company experiences early in life doesn’t last forever. It will eventually level off and possibly decline.
To learn more about the strategies a business can use to encourage sales growth, read this post:
5 FUNDAMENTAL BUSINESS GROWTH STRATEGIES
Think about what’s happening with units sold (or whatever the metric is) and pricing.
Revenue is the biggest determinant of Net income. So, dedicate some serious thought to the subject. That being said, don’t overthink it and get too creative. Stick with scenarios that you can back up with solid reasoning.
Cost of revenue
Refer to historical Gross margin %’s here. Also, be mindful of what the industry average is.
Some businesses, like biotech and software, could have relatively low COR and high Gross margins. Manufacturing companies are likely to have the opposite.
Keep in mind that part of the COR amounts is going to be made up of fixed costs. These are costs that will remain level even as the number of units produced increases.
On my sister site, SpreadsheetsForBusiness.com, I wrote a post on operational leverage. Familiarizing yourself with this concept could help you forecast COR and operating expenses.
Operating expenses
A lot of SG&A costs are going to be fixed in nature. Not surprisingly, they are among those that are cut first when times get tough.
The importance of Research & development will depend on the company. Theoretically, money spent here should result in higher sales within a few years. That depends on management, however.
If the company you’re analyzing invests a lot in R&D, read this post:
EFFECTIVE R&D MANAGEMENT – 5 REAL-LIFE METRICS ANALYZED
Frequently, you’ll see companies consistently spend the same percentage of revenue on Research & development. You’ll also see some consistency among companies in the same industry. So, if the company you’re analyzing is spending way more or less than the competition, consider if there might be a reverting-to-the-mean situation.
Keep an eye on the Operating margin % for the years you’re forecasting and the years past.
Interest and other income
The amount of Interest income will depend on how much Cash you expect the company to hold in the future. More mature companies tend to hold relatively more cash.
Conversely, Interest expense is dependent on the relative amount of Debt that a company has outstanding. Mature companies can have considerable amounts of debt. But, in amounts that are appropriate for their size. It’s young companies (and possibly those in trouble) that tend to be heavily leveraged.
Speaking of leverage (of the financial variety), I also wrote a post on the subject on SpreadsheetsForBusiness.com. Give it a read if you’d like to better understand the benefits and detriments of borrowing for companies.
Other income & expenses might be a shot in the dark. Fortunately, they shouldn’t typically amount too much. Their effect on Net income should be minimal.
Taxes
The current U.S. corporate tax rate is 21% (Source). However future administrations may change this rate. States may or may not charge income tax. Past losses can offset Pretax income. The company may conduct business internationally. And so on…
Whew.
Taxes are complicated. Unless you know of something iron-clad that will materially affect taxes in the future, I’d suggest just using a conservative rate. Keeping in mind the effects of negative Pretax income.
Net income and EPS
As you know, these are calculated automatically. They are a result of what you entered previously. Net income is the basis for determining the net present value (NPV) of this company.
Terminal values
As I mentioned above, I only recommend forecasting the income statement out fifteen years or so. Net income and EPS only calculate as far out as you forecast revenue and expenses.
What if you plan on holding this stock beyond the forecasted time period?
In the spirit of not overthinking things, we’ll use something called a terminal value.
These are Net income amounts that aren’t derived by subtracting expenses from revenue. All you’ll do is take the Net income from the last year of your forecast and do one of three things:
Raise it, lower it, or keep it flat.
If you think the company will move past its maturity at the end of the forecast you can choose to have Net income decrease by 3% for every year thereafter.
Or, maybe you think that they’ll enter into maturity right around the time your forecast ends. In that case, you could speculate that Net income will only grow at the rate of inflation (say 1.5%) from that point forward.
It’s really up to you. Just make sure that you have a value in the Net income field for as long as you anticipate holding this stock. That will ensure that your NPV calculation is as accurate as possible.
Settling on a value
All this work is about to pay off.
With a Total value amount, anyhow. Not necessarily a home run stock pick.
Here are the fields to enter in cells E2 through E7:
“Discount rate”
“NPV”
“Net cash”
“Total value”
“Per share”
“Under (over) val %”
Leave Discount rate (F2) blank for the time being. That’s a whole discussion in and of itself.
The formulas
Calculating NPV will require the use of a function. No matter if you’re using Excel, Sheets, or some other spreadsheet program, the function should be the same.
In cell F3, you’ll enter something similar to the following “=NPV(F2,T42:BZ42)”. F2 refers to the Discount rate, which you’ll enter later (F2).
T42:BZ42 refers to forecasted Net income. If your Net income is on a different row (which it very well might be) then change the 42 to whatever row is appropriate.
Finally, why columns T through BZ? Column T (2019) is the first year of future cash flows. Column BZ (room for terminal values) is the last.
If you want your terminal values to go beyond BZ, you’re welcome to change it. Me, personally, I probably won’t be around that long so there’s no need to forecast out any farther.
That’s it for the functions, the rest of the formulas are pretty easy.
Remember that Net cash = Cash – Debt. So, in cell F4, enter the following: “=C8-C9”.
Total value = NPV + Net cash
In cell F5, enter “=F3-F4”. This is the present value of all future cash flows, with the effects of excess Cash or Debt factored in.
Per share = Total value ÷ Shares outstanding
In cell F6, enter “=F5/C6”. This breaks the Total value down into a Per share amount allowing it to be compared with the Current share price.
Under (over) val % = (Per share ÷ Current share price) – 1
In cell F7, enter “=F6/C5-1. This tells you the percentage that the Current share price is over or undervalued. Keep in mind that an overvalued stock would be represented by a negative percentage.
Back to the discount rate
The Discount rate will play a huge part in the NPV and, subsequently, Total value.
What does Discount rate mean? That’s a complicated subject and beyond the scope of this post. If you’re interested, I also wrote on the subjects of NPV and discount rates on SpreadsheetsForBusiness.com. You can find a more in-depth analysis of the topics there.
Suffice it to say, the more uncertainty you have in your forecasts, the higher the Discount rate you should use. The higher the Discount rate, the lower the NPV, all things being equal.
A good point of reference is to look at what rate the company is paying for borrowed money (Debt). Your discount rate should be higher than that. Why? Because debt is senior to equity. If the company were to become insolvent, the debtors would get paid first. So, as an equity holder, you are taking more risk. Therefore, you should use a higher Discount rate.
Over time, you’ll get a better feel for what Discount rate to use. As will you for forecasting and analysis overall.
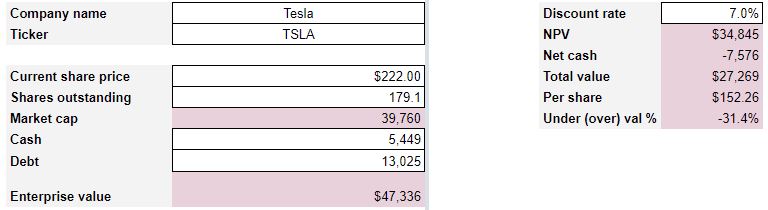
Here is what the information at the top of the spreadsheet will look like when you’re done:
Tesla (TSLA) stock valuation
Again, I really only plugged in Tesla’s information as an example. I also made some cursory forecasts to demonstrate the functionality of the stock analysis spreadsheet.
Admittedly, I did learn a good amount about Tesla that I did not previously know. But, this is no rock-solid forecast of this company’s stock. I’m not dying on that hill.
Anyhow, if you’re curious, here’s the Reader’s Digest version of how I arrived at the valuation I did:
Since I assumed that Telsa was only going to last another thirteen years or so (remember the Lindy effect), I had them going through the entire business life cycle during that time. It might not be that they shutter the factory in 2032. But, maybe they get purchased by another, more established, auto manufacturer.
So, I had revenue peak near $300 billion in 2028 and gradually decline from there.
I also had the Gross margin % erode down closer to 9%. This is more in-line with the established manufacturers.
Taxes were expected to level out around 21%. Because who knows who will be President in 2020, 2024, and 2028?
The result of all of this was a turn to profitable in 2020 with a Net margin % that held pretty steady across the model at roughly 3%.
Oh, and I used a 7% Discount rate. I could be convinced that this should be a bit higher.
The culmination of all this effort was a current valuation of Tesla stock at $152.26. The Current price, as of this writing, was $222.30 – representing an overvaluation of 31.4%.
All in all, it would seem that the market has a higher opinion of Tesla’s future prospects than I do.
Maybe this stock is a good buy? But, is it a good fit for your portfolio? Read this post to find out:
CREATE AN INVESTMENT PORTFOLIO THAT LETS YOU SLEEP AT NIGHT
Analyzing stocks in Excel (or Google Sheets)
Investors can use Excel and/or Google Sheets spreadsheets to efficiently build models, templates, and formulas that will tell them exactly what they need to know to make an investing decision. All they need to do is type in (or import) the necessary information. These spreadsheets can be built from scratch or you can download an existing spreadsheet and customize it.
Spreadsheets are ideal for analyzing stocks. Excel and/or Google Sheets allow you to create models of company financials into the future. With these models, you can plug in historical financial information and learn whatever it is you want to know about the stock – from a quantitative standpoint anyhow.
Excel end Google Sheets make calculating the present value of future cash flows easy. Which, in turn, can provide insight into the intrinsic (true) value of a stock. Furthermore, spreadsheets make calculating financial ratios easy.
Unfortunately, what Excel and Google Sheets can’t do as well is qualitative research. The subjective analysis. Things such as:
- Determining if senior management has the right qualifications
- Understanding what growth stage the company is in
- Determining the company’s strategy in light of its growth stage
- Performing a conversion funnel analysis
Ultimately, in my opinion, a spreadsheet program like Excel or Google Sheets is a must-have for analyzing stocks. It’s important, however, to understand their limitations. You probably don’t want to make investment decisions solely on quantitative analysis. Nevertheless, having a good model can help you efficiently separate the quality stocks from the ones you want to avoid.
Writing about your stock analysis
A formal stock analysis includes factors that affect the stock, risks the company faces, scenarios that might play out, and, of course, a valuation along with a recommendation. Of course, as an individual investor you can benefit greatly from writing notes that are much less formal. This informal stock analysis can save time and provide valuable feedback in the future.
Formally speaking, an equity research report is a summary, written by an analyst at a hedge fund, asset management company, or other financial institution. These summaries serve to convince someone whether a stock is recommended for purchase or not.
Formal equity research reports will often include some of the following:
- A summary of the company
- Factors that would contribute to a rise or fall in stock price
- Risks that the company faces
- A valuation analysis
- Different scenarios that could affect financial results
- And…most importantly, a recommendation
Most individual investors won’t have to write a formalized stock analysis report. However, you may find it useful to take notes on what you uncover as you analyze a given stock. Particularly, notes regarding the subjective or qualitative aspects of stock analysis.
There are a couple of benefits to this.
For starters, it will help you to understand what you were thinking when you decided to invest in a given stock. Rereading your analysis, at some point in the future, will provide valuable feedback. This feedback will be beneficial whether the stock’s done really well or really poorly.
Another benefit of keeping notes on your stock analysis is that it will help you get back up to speed. For instance, if you decide to pass on this stock now, but might reanalyze it in the future.
It’s for this reason that I recommend that you save your old valuation spreadsheets too. Doing so will allow you to save time when you want to re-calculate a stock’s valuation.
The best stock analysis websites
Finviz (finviz.com), Morningstar (morningstar.com), and Motley Fool (fool.com) are three of the most frequently recommended stock analysis websites. Each provides a unique perspective and valuable tools for profitable stock analysis.
For my part, the best stock analysis website is the SEC EDGAR database. Here, you can get access to every piece of financial information that that company makes public. Coupled with an Excel spreadsheet (or Google Sheet), you can build a customized stock analysis tool that delivers exactly what you need to make investment decisions
Also, I’ll give an honorable mention the Yahoo! Finance. Though the news and commentary are generally worthless (as far as I’m concerned) I do like the layout of the website and the ease with which I can find quick and simple information.
As far as other stock analysis websites go, it depends on what you’re looking for. If you’re looking for fundamental financial information you’ll use need one type of website. If you’re looking for technical analysis or charting information, you’ll need another.
Also, what’s best for one investor might be useless to another. Dictating the best stock analysis website is a very subjective determination. That being said, below are a few websites that come highly recommended.
Finviz
Finviz’s website has a highly regarded stock screener. The stock screener is free to use and offers a multitude of different attributes to filter stocks. Screeners are handy for narrowing down your search for new stocks to invest in. A good stock screener can actually do a lot of your financial ratio analysis for you too.
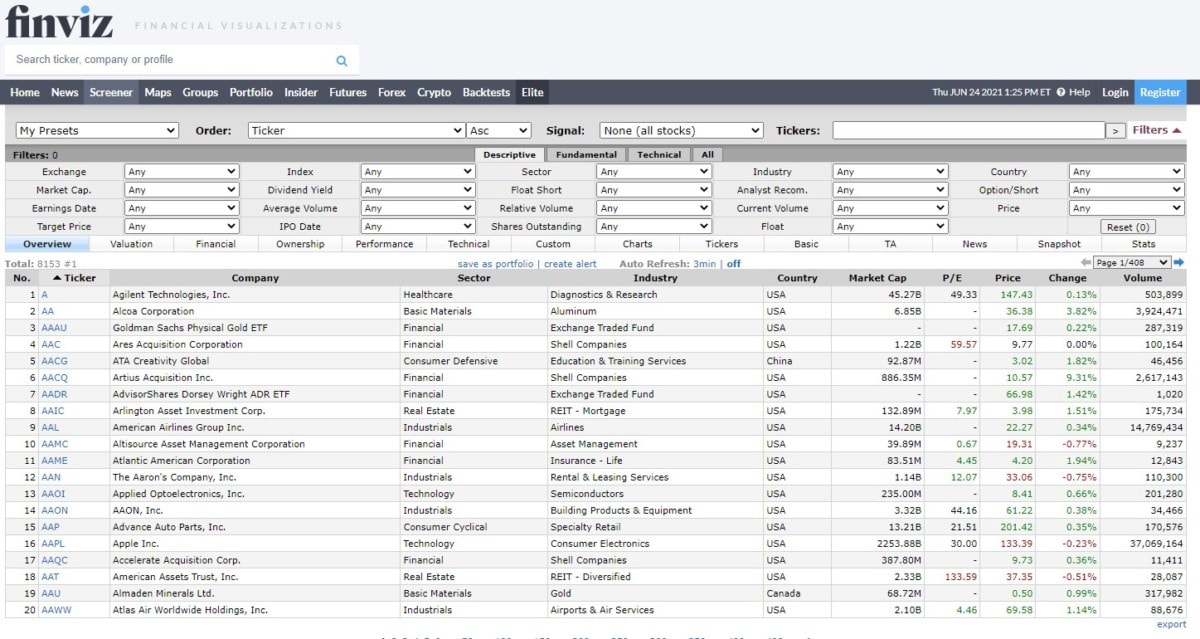
Credit: finviz.com
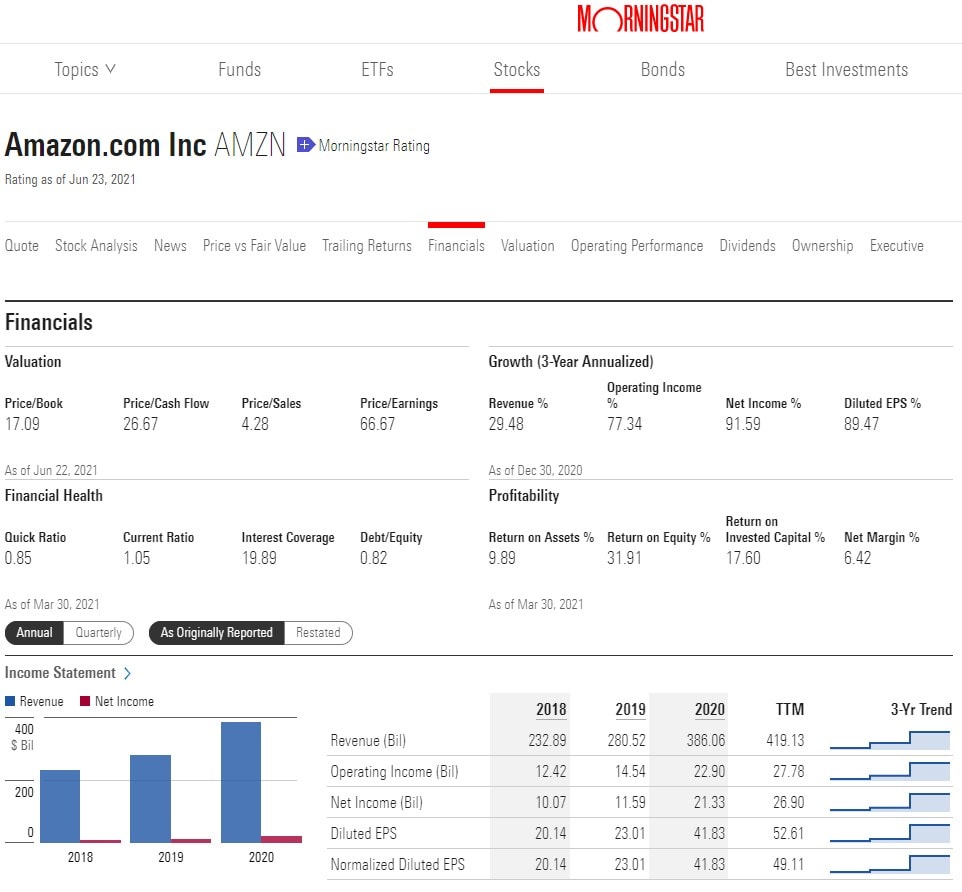
Morningstar
Morningstar is primarily known for its mutual fund research and analysis. However, in my experience, their stock information is also quite good. Personally, I particularly like visuals on the Financials tab of their quote page. I also appreciate the amount of historical information they provide.
Motley Fool
Finally, there’s the Motley Fool website. For my part, I would refer to Motley Fool more for commentary than for data. From what I’ve seen, they avoid the political trappings that Yahoo! Finance falls into. Furthermore, I’ve seen them write conflicting opinions on given stocks or industries. Which, might make them sound flaky to some people. But, to me, it implies that they offer a fully fleshed out perspective.

Credit: fool.com
A thorough and complete stock valuation spreadsheet
What else would you include in a stock analysis spreadsheet?
Do you have any tips for forecasting the income statement into the future?
Do you know how to automate the retrieval of detailed financial statement data? Either with XBRL or via some other means?
If so, join the conversation on Twitter!
Contents
- Download the Valuation Spreadsheet
- The inspiration for this model
- Understanding the valuation spreadsheet
- Quarters, years, and financial statement lines
- The income statement
- The balance sheet and cash flow statement
- How to create a stock analysis spreadsheet without entering any data!
- Forecasting future earnings
- Settling on a value
- Analyzing stocks in Excel (or Google Sheets)
- Writing about your stock analysis
- The best stock analysis websites
- A thorough and complete stock valuation spreadsheet


Just want to try it out.