
Consistently developing new products and services that meet the needs of customers is a key strategy for growth. There are five metrics that can be used to gauge effective R&D management. These are R&D spending, R&D headcount, new products released, new product sales, and patent production.
Though it is a very inexact science, examining these metrics can help you, as an investor, understand which companies have a product development strategy that can help increase revenue. More importantly, perhaps, an analysis such as this will help you avoid the “duds” of the industry. Those who talk about the importance of innovation, but take no action to back that talk up.
Effective R&D management and it’s relationship to revenue growth
This post was inspired by Point 3 of the 15 Points mentioned in Philip Fisher’s book on investing – Common Stocks and Uncommon Profits.
Point 3 is summarized as follows:
How effective are the company’s research-and-development efforts in relation to its size? To develop new products, a company’s research-and-development (R&D) effort must be both efficient and effective.
(Source)
Money spent on R&D is an investment. A return is expected. Unfortunately, there might not be any direct correlation between R&D spending and overall performance (Source). However, that doesn’t mean that the company you’re analyzing isn’t sitting on a lottery ticket. It’s up to you to look at the quantitative and qualitative information and draw your own conclusion.
Many of the companies you research will have at least one page on their website dedicated to the topic of R&D. Here, they’ll outline their philosophy on the topic and maybe give you some insight into the five metrics mentioned below. At the very least – I would say that the amount of information provided here is correlated with the emphasis put on R&D at the organization. If the topic is glossed over, it’s probably not too important. If it’s covered in pretty good detail, it’s probably a focus of theirs.
R&D metrics
Metrics for effective R&D management fall into two basic groups: inputs and outputs. Inputs include R&D spending and R&D headcount. Outputs include new product sales, patent production, and new products released.
Surely, there will be some contention regarding these metrics. Some might consider them outdated and inadequate. An obsolete means of gauging the effectiveness of a company’s R&D efforts. Maybe, maybe not. The point of this post isn’t to make you an innovation expert. Rather it’s to help you on your way to becoming an expert in investing.
As with my previous posts related to Philip Fisher’s points, I will attempt to apply what I write about by using a real-life example. This time around, I will be analyzing Helen of Troy Limited (HELE).
1. R&D spending
R&D spending is usually calculated as a percentage of sales. But, there is no hard-and-fast threshold for what constitutes “too much” or “too little.” Every industry will have different norms. Also, companies that are considered to be in the same industry might have vastly different portfolios of products.
For instance, Energizer Holdings, Inc. (ENR) is a household products company that competes with other household products companies. However, since household products encompass a multitude of different things, the amount of R&D spending that is appropriate might vary widely among each of those companies.
At the end of the day, if the R&D inputs are high and the outputs low, then something’s wrong. Conversely, if outputs are high, but inputs are low, then the question has to be asked: “why isn’t the company investing more inputs?”
Another thing to consider is the type of R&D investment made. Innovations that are transformative vs incremental have the potential to provide more extraordinary returns.
Everything needs to be taken in context and all numbers need to be appropriately qualified.
In-house vs acquired R&D
This post will focus on R&D that’s done in-house. It’s worth noting, however, that all business growth strategies, product development included, can be acquired.
Money and effort expended on R&D are not always rewarded. There is a definite risk involved. Just as discussed in my post on business growth strategies – sometimes it makes more sense for a company to acquire these opportunities than to undertake them itself.
That being said, the cost to acquire R&D can be steep. Many times, the cost is an ongoing, variable cost in the form of license fees, royalties, or something similar. Variable costs are not always better than fixed costs. Sure, you only pay for what you sell. But, as outlined in this post on my sister site, SpreadsheetsForBusiness.com – cost structures that are heavy on variable costs might not be able to take advantage of the benefits of operational leverage.
Our intuition might tell us that R&D spending should be higher in fast-paced industries. But, consider that, in an industry where there’s a lot of pressure to bring innovations to market ASAP, competitors might rush ahead – whether they’re truly ready or not. As a result, your company may feel uncertain about whether to continue moving forward or if money and effort are now sunk. It’s because of this, that in-house R&D might be more suited to industries that have more moderate rates of growth.
2. R&D headcount
The number of people in a company working on R&D is another metric to consider. Until artificial intelligence becomes a thing (if ever), research will be done by humans.
While every publicly-traded company is required to specify their R&D spending, they are not required to state how many people they have working on R&D. So, the best you might be able to do here is an estimate.
Web search
The simplest way to start your hunt for this information is to do a simple web search. “[company name] r&d headcount” might give you what you’re looking for.
You’ll probably get results that are mostly garbage. For instance, something like this:
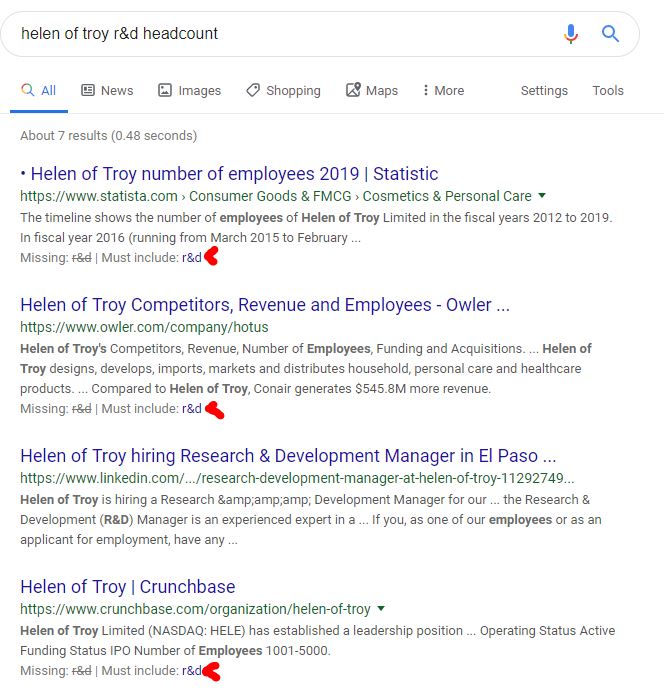
Three of the top four results were missing a word that was a critical part of what I was searching for! Ridiculous! If your search pulls some similar stunt, be sure to click on the word that it “Must include” (as if that wasn’t already implied) to get results that are, hopefully, a little more relevant.
Anyhow, as I said, this is a long shot. But, on the off chance that this information is on a company web page, or in a press release, it’s worth the time to take a quick look.
10-K
SEC filings are full of valuable information and should be consistently referred to throughout your analysis. This is another longshot but is a quick and easy search.
For simplicity’s sake, I would just search the 10-K. Open it in your browser and hit Ctrl+F. Type in “headcount” or “head count” and…maybe…you’ll find the info you need.
If not, you’ll have to move on to some more rigorous methods of obtaining this information.
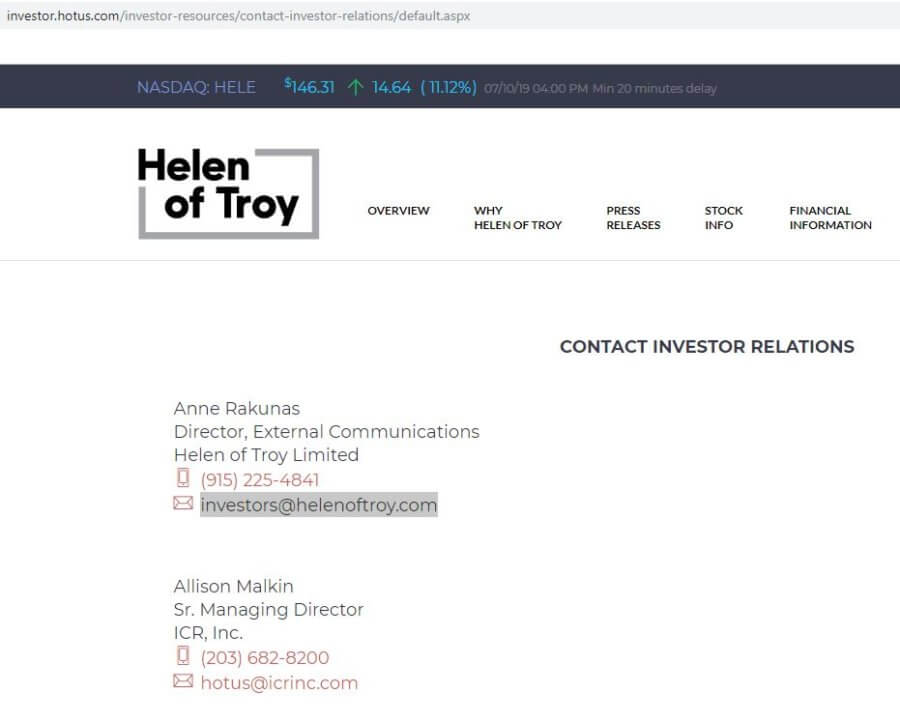
Contact investor relations
Every public company will have an investor relations department. In addition, they should also have a means for you to contact them via email and/or phone.
There’s no harm in reaching out and asking about this (or anything else). The worst they can do is ignore you or decline to answer. You might be surprised at the information you can obtain.
They probably won’t respond really quickly. So, best to move on with other aspects of your analysis until you’ve given them a few business days to respond. At which point, if you haven’t received a satisfactory answer to your inquiry, it’s time to move from official numbers to estimates.
Use LinkedIn to get a ballpark figure
If none of those methods work we can refer to LinkedIn for a very loose estimate of how many R&D employees a company has. Obviously, we assume that most employees have a presence on LinkedIn. Some won’t, though. Also, not everybody’s LinkedIn profile is going to be up-to-date.
If you’re using LinkedIn to research R&D headcount, be sure to include any major subsidiaries that the company has too.
Just go to the company page, click on People on the left-hand menu, and then Search employees by title…
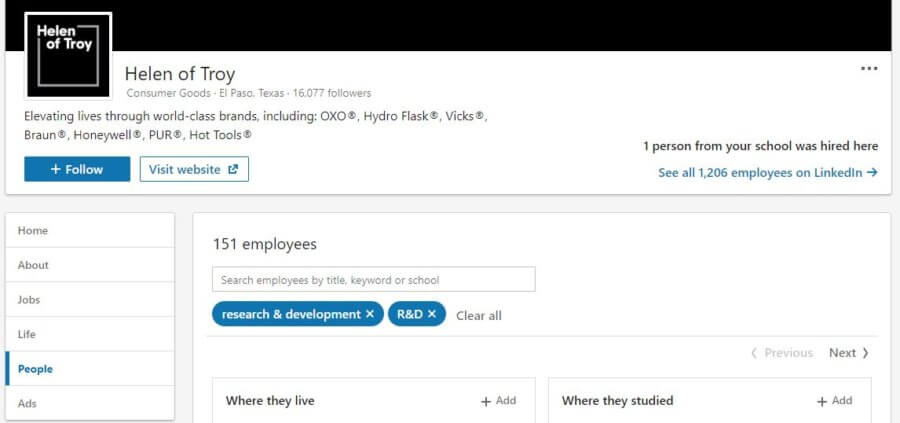
In the search bar, type in “research & development”, “R&D”, or both.
This won’t be an exact count. But it should allow us to get an idea of relative R&D headcounts for the company we’re analyzing and its competitors.
On that note, I think it’s important to use the same source when comparing headcounts across different companies. Particularly if you’re referring to LinkedIn. LinkedIn is obviously inexact and it wouldn’t be prudent to make judgments on some data that’s official (from the 10-K or a press release) and other data that’s a ballpark estimate (LinkedIn).
3. New product sales
By its nature, R&D is a long-term investment. The fruits of this labor may not manifest themselves for years – if ever.
One way we can attempt to see how R&D investment has paid off is by estimating new product sales. I say “estimate” because that’s likely the best you’ll be able to do. Publicly traded companies are required to divulge certain thing. New product sales are not one of those things.
How to estimate new product sales
Better methods might exist, but, for my part, I refer to the trusty ol’ 10-K. If you search for the term “new product” (Ctrl + F), you should find several instances of it being used throughout the document.
Ironically, you’ll probably see it touted as something of great importance, even if “new products” are never mentioned elsewhere in the 10-K. Some companies will pay lip service to the importance of new products, but can’t legitimately point in instances where new products meaningfully contributed to increased sales.
You’ll also probably find “new products” mentioned in the Risk Factors section of the 10-K. Here, the company will likely make mention of how important new products are in order for them to compete effectively.
What we’re really looking for, however, is something like this:
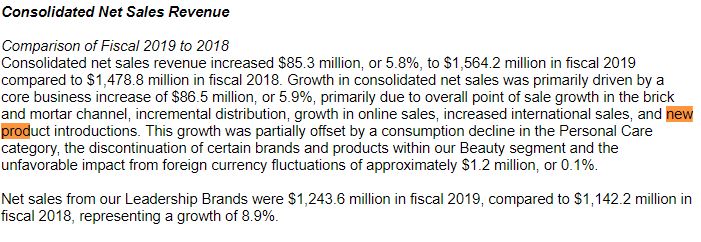
What we’ve got here is “new products” mentioned specifically as contributing to an increase in sales. Obviously, there are other reasons listed too and we don’t really know how much each reason contributed to the growth.
We could dig around to see if the other reasons are itemized elsewhere in the 10-K and then subtract those amounts from the overall growth figure.
For instance, in the example above, an increase in core business sales of $86.5 million is mentioned. Brick and mortar, online, international, and new product sales are all listed as the reasons. If actual increases in brick and mortar, online, and international sales are listed elsewhere – then the new product sales can be reasonably estimated by subtracting those other amounts from the increase in core business sales.
An easier way
That certainly works, but it is time-consuming. Also, those other reasons very likely won’t be itemized elsewhere. So, I opt for a less exact, but quicker method to estimate new product sales.
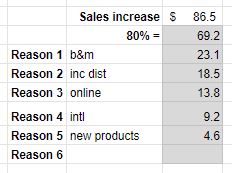
I made a little calculator in a spreadsheet that, first of all, calculates 80% of the increase in sales. Why 80%? Because of the Pareto Principle, I’ll assume that reasons listed account for the bulk of the increase (80% or so).
From there, I assume that the reasons listed are in order of contribution. For example, the first reason contributed the most, the second reason the second most, and so on…
The calculator breaks that 80% amount down based on the ranking of the reasons.
Very inexact, I know. But it gives me a ballpark figure to work with. Here’s what it looks like:
What if no mention of new products (in relation to sales) is made in the 10-K? If that’s the case, I simply assume that there were none. Or, if there were new product sales for that year, they were so immaterial that they wouldn’t have any impact on the analysis.
4. Patent production
One disadvantage of using patent production as a metric is that patents don’t necessarily translate into revenue. Sure, they provide certain protections. But, at the end of the day, it’s revenue growth that we’re after.
That being said, counting patents gives us something tangible to help determine how productive the folks in the R&D department are. But, that doesn’t tell the whole story.
One company might be assigned hundreds of patents every year that are merely novel. Another company might only be assigned a handful of patents every year. But, they are all revolutionary and add a lot of value.
You can see that, like most things, patent production needs to be looked at in the right context.
Nevertheless, counting the number of patents that a company is granted can complement our other research efforts related to R&D.
Where to find patent production information
In order to find this information, we’re going to go right to the source – the U.S. Patent and Trademark Office.
From this page, you’ll want to click on the link that says “Advanced Search” under the “USPTO Patent Full-Text and Image Database (PatFT)” heading.
In the upper left corner, you should see a “Query” box. Writing a query here takes a little getting used to, but it’s not too hard. For our purposes, we’re only interested in two fields: Assignee Name (AN) and Issue Date (ISD).
The dollar sign ($) serves as a wildcard. Which is particularly useful when it comes to the Assignee Name field. A query using these two fields might look as follows:
AN/helen-of-troy$ AND
ISD/20160101->20190716
For my Assignee Name, notice that I was as non-specific as I could get away with. I included the wildcard at the end because I didn’t know if the results would be Helen of Troy, Inc., Helen of Troy Limited, or some other variation. The wildcard helped ensure that I retrieved all Helen of Troy results.
Also, note the AND operator between the two fields.
As far as the Issue Date is concerned, you can probably see that it’s in a YYYYMMDD format. The “->” between the dates specifies that I am looking for a range. In this instance between 01/01/2016 and 07/16/2019.
That’s all there is to it. The results page should tell you how many patents match your query and will look something like this:
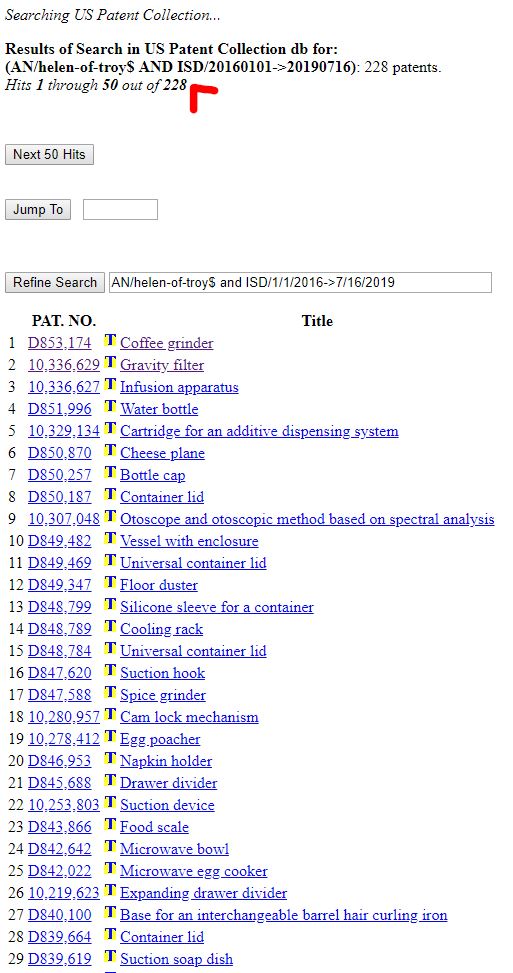
You might click on a couple of the results to make sure they were issued to the company you were analyzing.
Also, just as with the R&D headcount step, don’t forget to search for those subsidiaries!
5. New products released
In my opinion, researching this metric is optional. I say that for a couple of reasons.
First of all, it’s time-consuming to collect. If you’re researching a company with a lot of brands, there is a lot to sort through. Especially if you want to research competitors too.
It is also difficult to quantify. There is no single, authoritative source for the number of new products released by a particular brand. What is considered “new” is very subjective too. “New” for one type of product might be ancient for another product that has a different life cycle.
The potential time and effort needed to get 100% accurate information just aren’t worth the reward. Hell, to even get in the ballpark isn’t worth the time needed.
Also, ultimately, if new products don’t translate into new product sales, they’re inconsequential anyhow. The idea here, I think, is to just get an idea of how much activity each brand has in terms of new products.
How to get a (rough) idea of new products released
First, look up all of the brands that your company owns. If you’re researching a household products company (like Helen of Troy), the number of brands can number in the dozens.
Then, for each brand, do a search for “[brand name] new products”. But, before you delve into the results, narrow them down to actual new products by using the search engine’s tools.
In Google, if you click on the Tools button by the search bar, you’ll see a dropdown that says Any time. From here, you can select Custom range... and enter the date range of the results that you want to see. This prevents you from getting a result with the word “new” in it that’s from fifteen years ago.
For my part, I only wanted to see results for the year-to-date and the three full years prior to that. The same date range I used when researching patents.
Next, if you want, you can search the page for the word “new” (Ctrl+F). This helped draw my eye to the results that were actually related to what I was looking for.
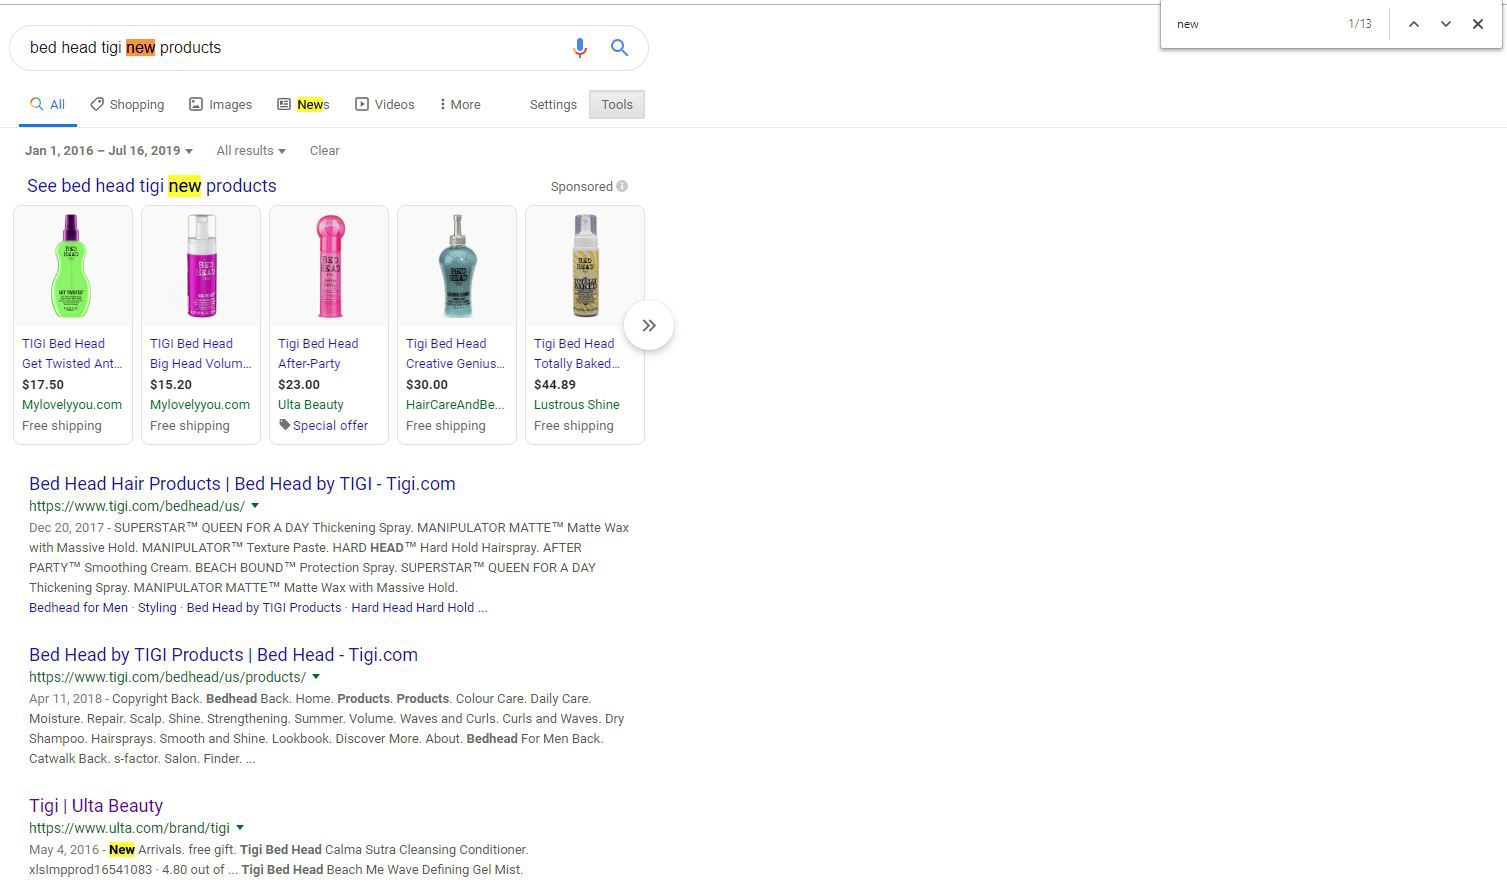
Click to enlarge
How much time and effort to commit?
Depending on the company/industry in question, you might limit this step to your company only and skip the competitors. As I said, it can be time-consuming. It’s up to you though.
Personally, I’m only looking to get a general idea of the number of new products released by the company I’m analyzing. Trying to gather some context for all of the information I quantified earlier.
You might jot some notes about what you’ve found too. For reference, if needed later. Again, this metric really only serves as a complement for those addressed previously.
Analyzing Helen of Troy’s R&D strategy
As has become a tradition on these Common Stocks and Uncommon Profits posts, I’ll be performing the analysis at hand on a real-life company.
I’ll switch things up and pick another random company for Point 3. This time around, I’ll look at Helen of Troy Limited (HELE). A company that I had never heard of, but did recognize a lot of their brands. Brands like Braun, Vicks, Pert, Revlon, and several others.
Let’s work through the five metrics for Helen of Troy and see what we find.
Helen of Troy’s R&D spending
Right off the bat, I can tell that R&D isn’t a priority for Helen of Troy. R&D expenses are obviously a small percentage of sales. Something I can tell without even running a calculation. But, for the sake of thoroughness – I will.
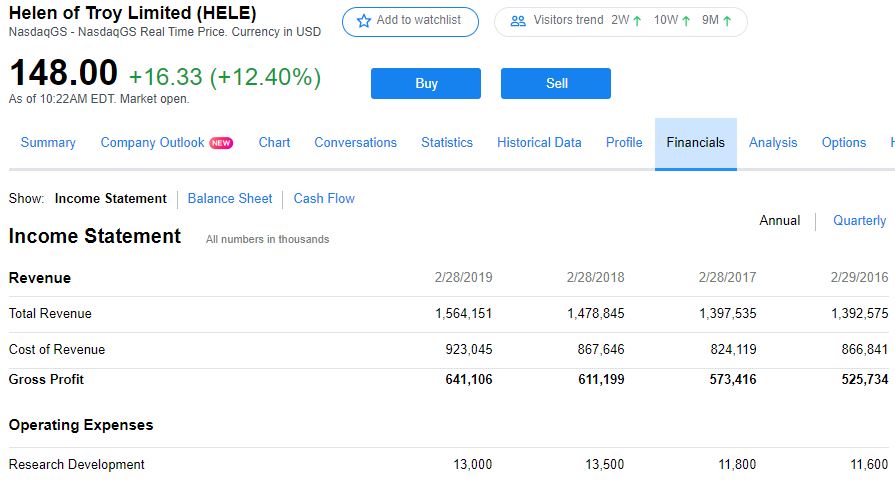
2019 = .8%
2018 = .9%
2017 = .8%
2016 = .8%
I had to take a screenshot of Helen of Troy’s R&D expenses from Yahoo! Finance because research and development were not itemized in their 10-K(!?). They did, however, make it point to state how they “…continually invest to strengthen our product design and research and development capabilities…” (Source).
But, maybe this seemingly low level of R&D spending is the norm. Maybe it doesn’t make sense to spend more. To help put this into perspective, let’s take a look at the R&D/revenue percentages for some other companies in the consumer products industry.
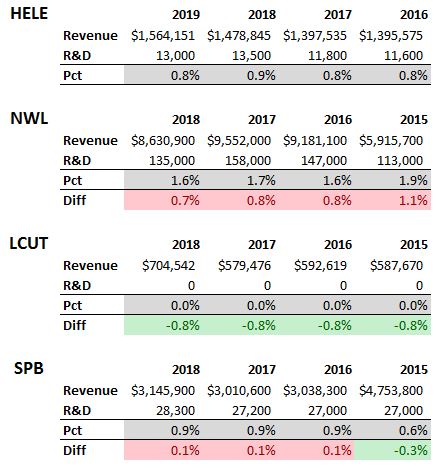
Okay, so we’ve got a mixed bag here. In general, Helen of Troy spent less than the competition (Lifetime Brands, Inc. [LCUT] notwithstanding), but not by much. Of these companies, Newell Brands Inc. (NWL), consistently spent the most. But, even they topped out at under 2%. This just isn’t an industry that throws a lot of money at R&D, it seems.
Helen of Troy’s R&D headcount
Since most R&D expenses are for salaries and benefits (particularly at Helen of Troy [Source]), we would expect there to be a correlation between R&D spending and R&D headcount.
Again, this information isn’t quite as easy to dig up as R&D spending, but let’s see what we can find…
I’ll start with the simplest method – a web search.
That didn’t turn up anything useful.
Neither did the 10-K.
For the sake of time, I rattled off an email to Helen of Troy’s IR people.

For the sake of efficiency, I also sent similar emails to Newell Brands and Spectrum Brands. I didn’t bother with Lifetime Brands, because their R&D spending was $0. So, I’m going to guess that there aren’t many people in that R&D department.
A day later, the only company I heard back from was Newell. Their response was “We do not break out this level of information.” Oh well, worth a try, I suppose!
Time to estimate
I would imagine I’ll get a similar response from the other companies if any at all. So, I’ll move forward with creating an estimate from what I find on LinkedIn. If need be, I can revise these estimates.
Again, this is very unofficial. But, my hope is that it will at least provide an idea of where my company stands relative to its competitors in terms of R&D headcount.
Here’s what I found after nosing around LinkedIn for about 20 minutes:
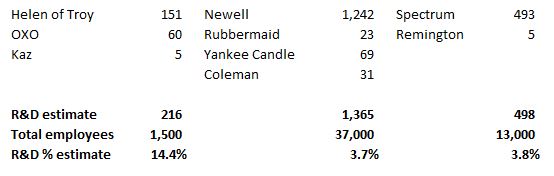
These numbers jive, somewhat, with what I found when looking at R&D spending. Newell has, by far, the most people in R&D. Spectrum has more than double Helen of Troy.
The percentages tell a different story, however. The Total employees numbers are official – I pulled them from the 10-Ks. It’s hard to say for sure since the R&D headcount numbers are very rough. But, it appears as though, Helen of Troy might commit more relative manpower to R&D, but keeps costs in check more than its competitors. That’s, admittedly, a big assumption. But, something to keep in mind when sizing up the broader analysis.
With that, let’s move away from inputs and shift focus to R&D outputs.
Helen of Troy’s new product sales
As with R&D headcount and spending, I opted to examine Helen of Troy’s competitors too in order to have some context.
By looking through each company’s 10-K over the past three fiscal years, and using my handy-dandy (wild ass guess) calculator, I came up with the following:
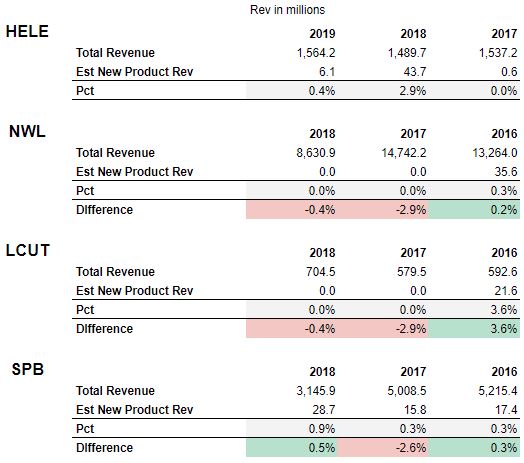
All in all, I think Helen of Troy compared favorably with its competitors in terms of new product sales. The exception being, of course, 2017 when new product sales seemed to be sparse for Helen of Troy, but robust for its competitors.
The only other company which appeared to have new product sales all three years was Spectrum Brands Holdings, Inc. (SPB).
Lifetime Brands, Inc. (LCUT), if you’ll remember, didn’t have any R&D spending. So, not surprising to see that there were very little new product sales for the past two years. 2016, on the other hand, saw a pretty big percentage of new product sales.
Lifetime certainly talked up the importance of new product sales in their 10-K. But, it seems that might not be something they’re able to deliver on year after year.
Helen of Troy’s patent production
After scouring the USPTO website for Helen of Troy, its subsidiaries, and its competitors, here’s an idea of the patent activity for each over the past three and a half years, or so:
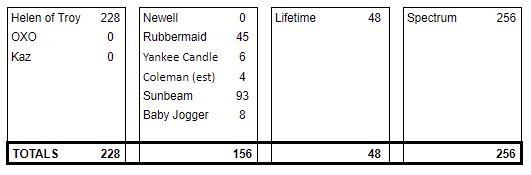
It’s remarkable, but not completely surprising, how all of these metrics seem to line up. R&D spending, headcount, new product sales, and patent production all seem to tell the same story.
Helen of Troy is aggressive with patent production, as is Spectrum. These two companies were also the ones who seemed to consistently produce new product sales. Newell (in spite of its R&D spending/headcount) and Lifetime produce comparatively little.
Helen of Troy’s new products
Helen of Troy lists thirteen brands on their website. It’s not Newell’s 40+, but it’s still quite a bit to sort through.
This step did help me gain some familiarization on Helen of Troy’s brands. What stuck out to me the most was how the majority of their new products seemed to be for the “durable goods” brands. OXO, Hydro Flask, and Hot Tools (curling irons, etc.) to be exact.
On the consumable side, there didn’t seem to be as much innovation. The only exception was the Bed Head brand which seemed to consistently produce new products.
As suggested above, I took some simple notes about what I found. Nothing really worth sharing.
I also made a cursory glance at Newell, Lifetime, and Spectrum brands. While I looked at every Helen of Troy brand, for the competitors, I only did some quick searches for their more well-known brands.
Conclusion on Helen of Troy – do they have effective R&D management?
Helen of Troy has performed respectably across all five metrics, I feel. From the limited available information, it seems to me that they are committed to innovation and appear to approach R&D in a relatively efficient and effective manner.
It’s Spectrum Brands Holdings, Inc., in particular, that impresses me the most. At least in regards to Point 3.
This highlights why it’s wise to include competitors in an analysis. Had I not included Spectrum in the competitor analysis, I might not have ever known about them. Their efforts in R&D have really impressed me and I’m curious to know more about their business.
Effective R&D management
As mentioned above, recognizing effective R&D management isn’t an exact science. It requires that a lot of guesses and estimations be made.
After you examine all these metrics, you should have a clearer picture of your company’s R&D situation. A picture that will, hopefully, help you determine its commitment to product development, sales growth potential, and attractiveness as an investment.
Do you know of a better way to estimate new product sales?
What other metrics might you use to judge a company’s research and development efforts?
Where would you go to find that information?