This is the simplest CCI indicator strategy there is. The strategy is to buy when the CCI reaches a level of +100 and to sell when it drops to -100. For better or worse, there is never a time to hold under this strategy.
The term “coincident” implies that it should be used in conjunction with another indicator. Not relied upon by itself. Nevertheless, even if an indicator is going to be used as “backup,” so to speak, I would like to know how well it can be relied upon to make correct predictions about the future direction of an asset. So, that’s why these models were built.
Summary of models
- The coincident CCI indicator strategy is unreliable. Only consider using during times of market volatility, not during extended bull markets.
- I tested the “standard” settings. Different settings might have worked better or worse.
- Trading long & short with this indicator strategy did not tend to reward traders enough for the risks taken.
- Indexing is likely a better choice than this particular indicator strategy. Buying & holding a winning stock is even better if you can find one.
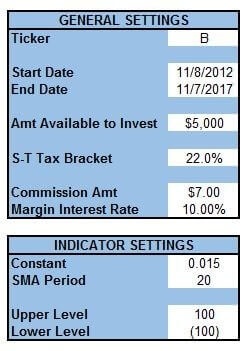
Settings
Dates will vary across all models. This allows us to see how this indicator strategy performs across different market environments.
The amount available to invest will be $5,000 for all. Not so much that most traders couldn’t come up with that amount. Not so little that taxes, fees, and margin interest will wipe it out.
Gains and losses on the long-only and long & short trading strategies will be subject to a 22% rate. The buy & hold and index investing strategies are subject to a long-term capital gains rate of 15%.
Commissions and margin rates are as follows. $7 per trade (buy and sell) for commissions. 10% for margin interest. Both are (more or less) what TD Ameritrade charges at the present.
The period for the CCI is at 20. I’ve found 20 to be the unofficial “default” for this setting. 14 is also used frequently enough, but I’ve found that longer periods tend to provide better returns – so, 20 it is.
The constant for the CCI calculation is set at .015.
Finally, the upper and lower levels for the buy and sell signals are set to +100 and -100 respectively.
Barnes Group Inc. (B) Results
The model period for B is, of course, the same as shown in the pic above – 11/8/12 to 11/7/17.
Long-only and long & short trading strategies – B
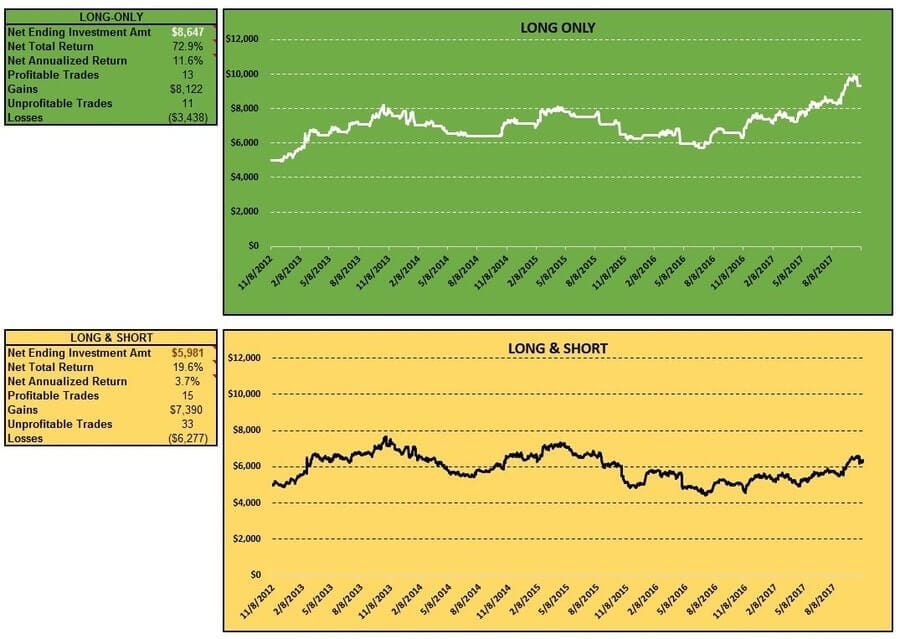
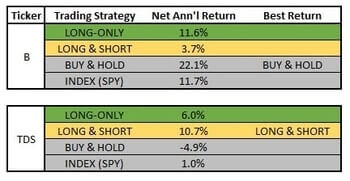
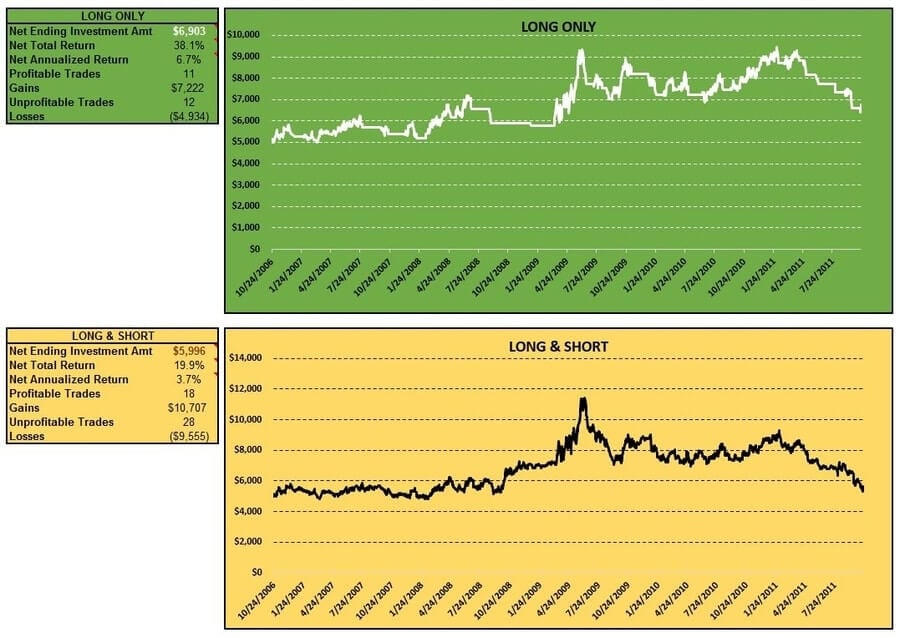
The long-only trading strategy didn’t do too bad. The net annualized return over the period examined was a solid 11.6%. There were not many more profitable trades than unprofitable ones; 13 to 11. But, when the long-only trading strategy was right, it was right to a bigger degree than when it was wrong.
The biggest gross profit from a trade wasn’t realized during the run-up the stock saw from Jun 2016 to Oct 2017. Rather it was realized early-on between Dec 2012 and Apr 2013 when the stock’s price rose from $21.40 to $27.89.
The long & short trading strategy didn’t fare quite as well. When it was right, it did have bigger gains. Unfortunately, it was wrong over twice as much as it was right. 15 profitable trades to 33 unprofitable ones. This poor performance only resulted in a paltry 3.7% net annualized return.
If we do the math, we know that shorting B was only profitable 2 times and unprofitable 22 times. During the stock’s run-up from Jun 2016 to Oct 2017 gains from long positions were cut in half by losses from short positions. Consistently wrong sell signals eroded any potential gains.
Here’s a look at the long-only and long & short tables and charts:
Buy & hold and indexing investing strategies – B
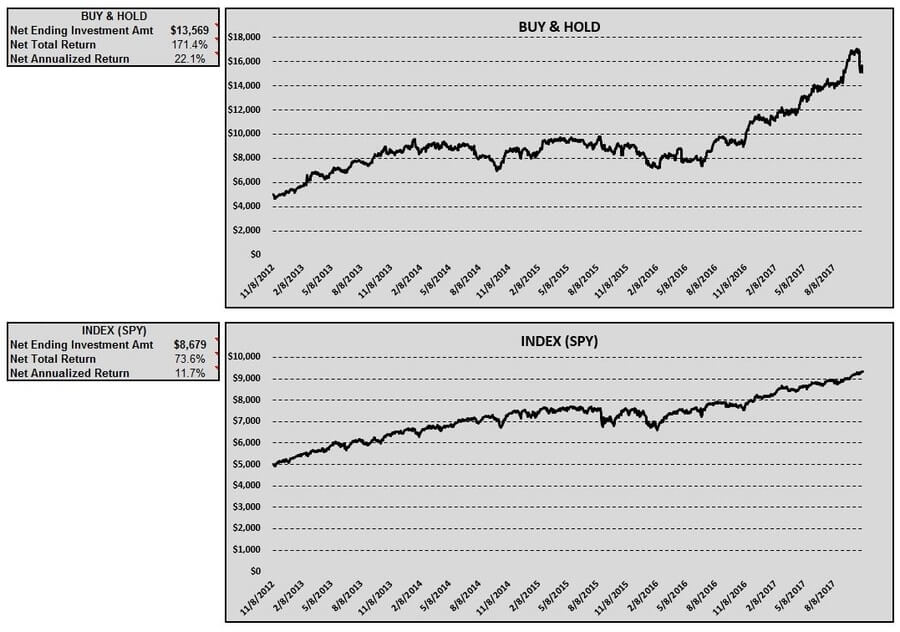
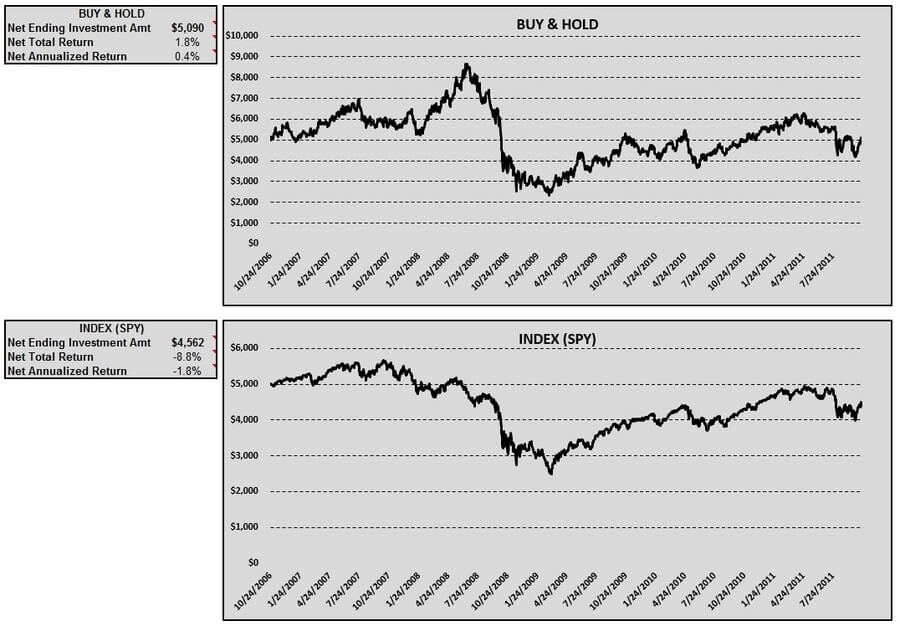
Buy & hold was where the money was. Getting in on B 11/8/12 would have turned your $5,000 into $13,569 (after taxes and commissions) if you cashed out on 11/7/2017. This is a 22.1% net annualized return – very healthy! The majority of those returns coming the final 17 months of the period examined.
So what would have boring old indexing got you? Well, about the same as using the long-only trading strategy, but with a lot less work (and risk). Investing in SPY shares would have resulted in a net annualized return of 11.7% for the model period.
Here’s a look at the buy & hold and indexing tables and charts for this model:
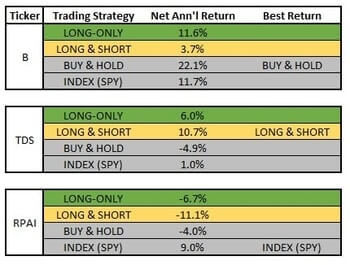
Coincident CCI indicator strategy return comparison – B
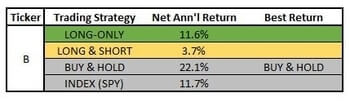
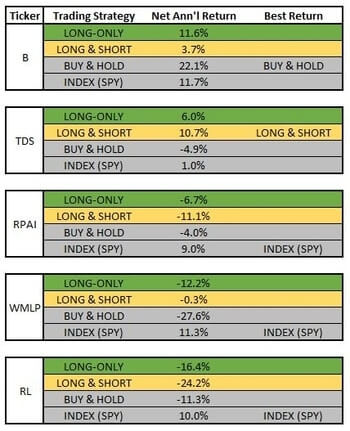
One model on one stock using one indicator strategy doesn’t prove anything. But, in this specific case, a trader would have been better off acting like an investor. Buying & holding B over the time period examined. Here’s a recap of the net annualized returns:
Telephone and Data Systems, Inc. (TDS) Results
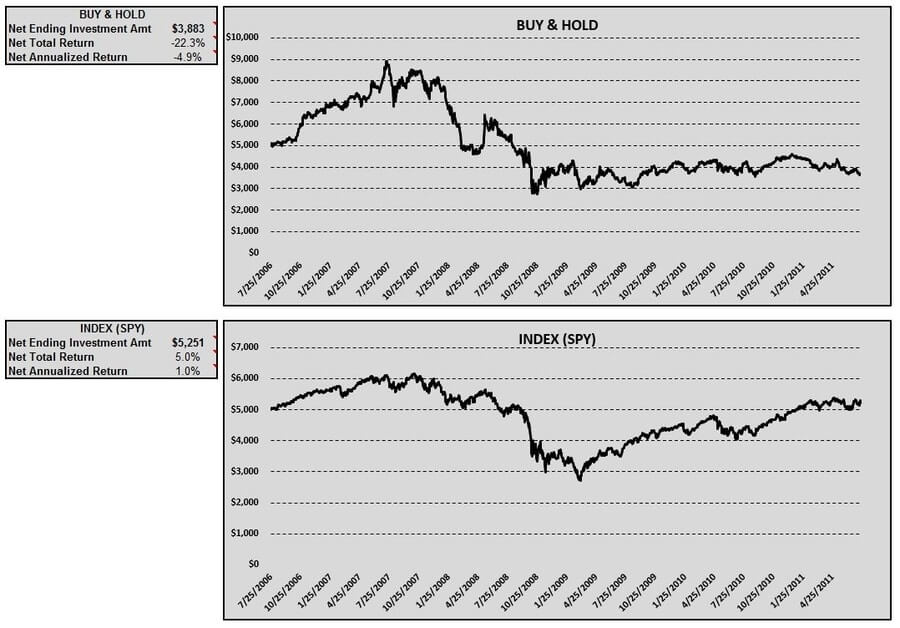
The model period for TDS is 7/25/06 to 7/22/11.
Long-only and long & short trading strategies – TDS
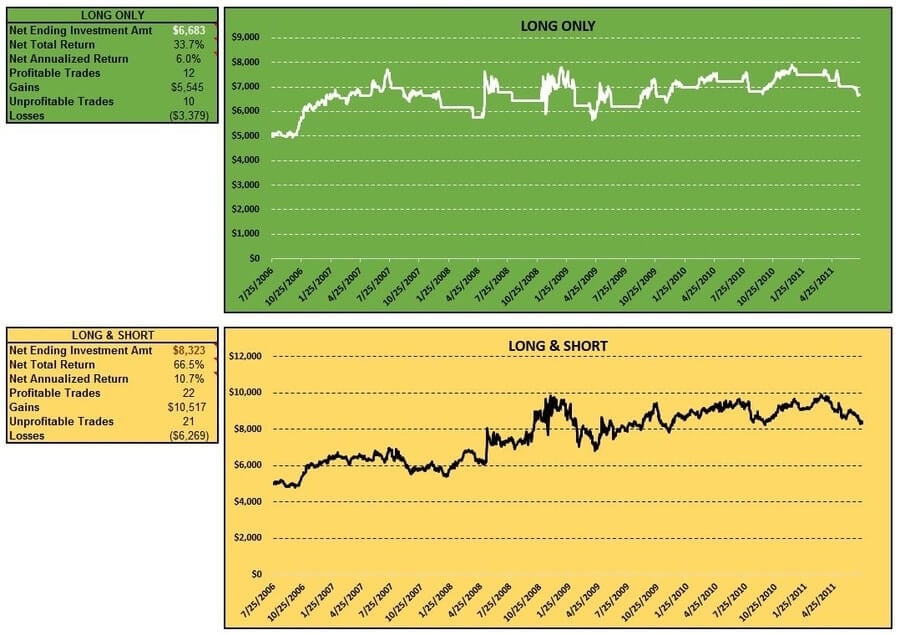
At a 6.0% net annualized return, the long-only strategy provided pretty mediocre results. Mediocre for most typical time periods. Obviously, with the Great Recession beginning in Dec 2007, this is not a typical time period. TDS hit an all-time high on 7/17/07, closing at 67.40. By 10/27/08 it had fallen to $20.60. Traders using the long-only trading strategy would have sat out a lot of those declines and would have even capitalized on a couple of the rebounds during this period.
Profitable to unprofitable trades were pretty even in number – 12 to 10 respectively. Just as was the case with B, the long-only trading strategy was right to a greater degree than it was wrong.
The long & short trading strategy was able to capitalize on the TDS’s decline between Jul 2007 and Oct 2008. In fact, the account value increased from $6,935 to $9,021 during that time. After that point until the end of the model period, gains were pretty nominal. The long & short trading strategy provided a (relatively) solid net annualized return of 10.7% for the entire model period.


Like the long-only trading strategy, the long & short trading strategy was pretty even on profitable and unprofitable trades; 22 to 21 respectively. Also, like the long-only trading strategy, gains were bigger than losses. So, the net effect was positive.
The long-only and long & short charts and tables:
Buy & hold and indexing investing strategies – TDS
As alluded to above, the Great Recession was hard on the buy & hold investing strategy. Buying & holding would have cost an investor -4.9% per year, net annualized return. During the model period, TDS came off of that all-time high and didn’t do much after.
We all know that the Great Recession was hard on the indexes. But, for the model period, investing in SPY would have yielded a (barely) positive return of 1.0% net annualized. From early 2009 until July 2011, the SPY fought back and erased a lot of its losses.
The buy & hold and index tables and charts:
Coincident CCI indicator strategy return comparison – TDS
Two stocks down in our examination of the coincident CCI indicator strategy with two pretty different results. Here’s what we’ve got so far:
Retail Properties of America, Inc. (RPAI) Results
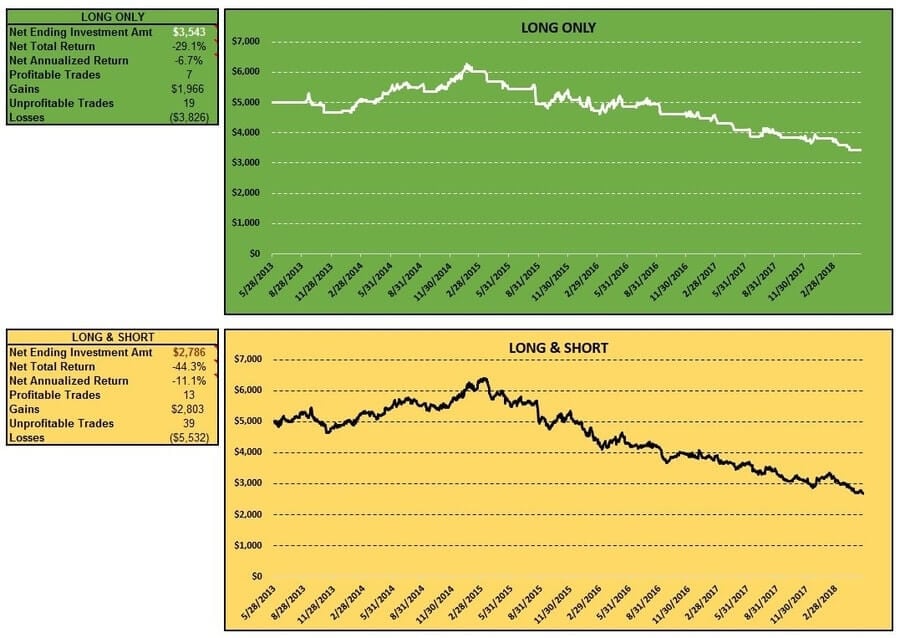
The model period we’ll use for RPAI is 5/28/13 – 5/25/18.
Long-only and long & short trading strategies – RPAI
RPAI does not look to be a stock for traders. Looking at the long-only trading strategy first, the net annualized return was a dismal -6.7%. Things didn’t start out so bad. The gross account value (before taxes and commissions) hit a high of $6,260 in Jan 2015 – early in the model period. Most of this rise was attributable to getting into RPAI at $15.25 in Oct 2014 and riding a nice rise to $18.21 in Jan 2015. This was the biggest gain a trader would enjoy using this indicator/trading strategy. After this point, losses would have eroded away at the account value.
Unlike the previous two stocks, profitable and unprofitable trades were not nearly as equal in number. Profitable trades were nearly outnumbered 3:1. Not much positive to take away from this strategy.
What about mixing in some short selling to try to capitalize on downward moves in the stock? No good either. Worse, in fact. A long & short trading strategy would have rewarded traders with a -11.1% net annualized return. Like the long-only trading strategy, this strategy would have enjoyed the run-up between Oct 2014 and Jan 2015. Plus, there were some gains to be made as RPAI backed off that high of $18.21 into the $15.50 range in Mar 2015. After that, it was the same story – loss after loss chipping away at the account value for the rest of the model period.
Also, like the long-only strategy, the long & short trading strategy saw 3x as many unprofitable trades as profitable. 39 to 13 respectively.
Here are the charts and tables for the long-only and long & short trading strategies:
Buy & hold and indexing investing strategies – RPAI
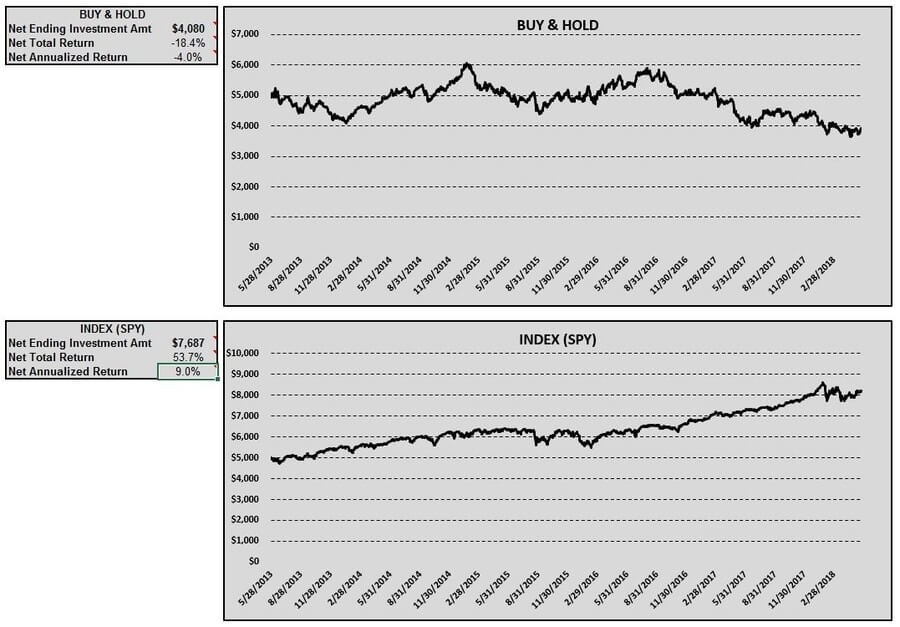
Alright, so we know that actively trading this stock (with this particular indicator/trading strategy combo) would have lost money. Is this a situation where trading could have at least helped to avoid buy & hold losses? No. Not only would you have saved a lot of time an effort by buying & holding RPAI over the model period, you would have come out ahead financially. The buy & hold investing strategy did not do well. But, it did better than actively trading, returning -4.0% net annualized. Throughout most of the model period, the gross account value fluctuated between $4,000 and $6,000. It wasn’t until 2017 that losses began to really mount.
With the other three strategies providing miserable returns, you probably know how this story ends. Indexing was the right play in this model, returning a healthy 9.0% over the model period. The SPY would have provided a nice, steady increase in value with no thought or effort needed.
Here are the buy & hold and indexing chart and tables:
Coincident CCI indicator strategy return comparison – RPAI
Three stocks examined under this indicator/trading strategy combo and three different results:
Westmoreland Resource Partners, LP (WMLP) Results
Let’s give this another go. The model period for the WMLP model is 12/13/11 – 12/13/16.
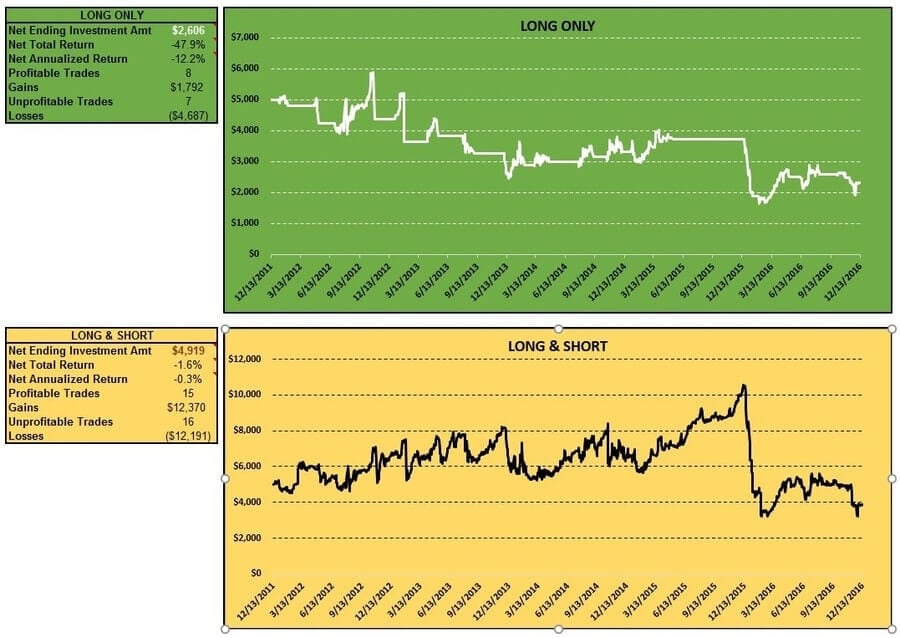
Long-only and long & short trading strategies – WMLP
The long-only trading strategy provided disappointing returns. Due in no small part to the dismal performance of the stock which started the model period at $153.02 and ended it at $6.08 (with very few upward moves in between)! Though the net annualized return was a miserable -12.2%, it’s something of a testament to the long-only trading model that performance wasn’t any worse. A lot of the stock price drops would have been sat out by a trader utilizing this strategy. At the end of the day though, this model really had no shot of providing a legitimate return.
Like most of the models we’ve looked at, profitable and unprofitable trades were nearly even for the long-only trading strategy at 8 and 7 respectively. However, whenever the model triggered a buy signal, this dog of a stock would typically drop. So, losses considerably outweighed gains.
If the long-only trading strategy was hopeless, then the long & short trading strategy should have been gold, right? Not quite. Well, actually, if you would have taken your gains and ran in Dec 2015, when the gross account value hit its high of $10,561, you’d have been sitting pretty. Not long after, the gross account value was cut in half. Though WMLP was trading in the single digits at that point, it was exceedingly volatile. When all was said and done, a trader utilizing the long & short trading strategy would have been left with a -.3% net annualized return (and probably an ulcer).
Like the long-only, profitable and unprofitable trades for the long & short trading strategy were roughly equal. 15 trades were closed with a profit. 16 were closed with a loss.
Here are how the charts and tables look:
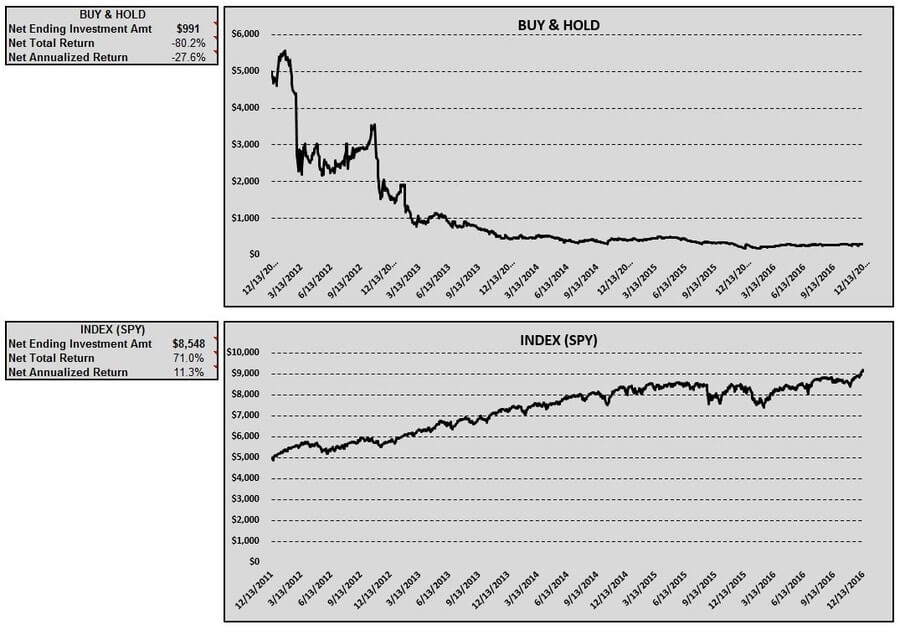
Buy & hold and indexing investing strategies – WMLP
As you might have picked up on, buying & holding WMLP over the model period would have been a costly mistake to the tune of -27.6% annualized. Why wasn’t it worse? Because of the tax offset provided by losing so much money. Taking that out of the equation, an investor who bought & held WMLP over the model period would have seen their $5,000 investment turned into $284!
Another thing that probably isn’t surprising, if you’ve read this far, is that indexing was the way to go. An investment in SPY would have provided a healthy 11.3% net annualized return. Indexing is boring, but that slow and steady climb would have provided healthy capital appreciation and would have had you sleeping better at night.
Here are the charts and tables for the buy & hold and indexing investing strategies:
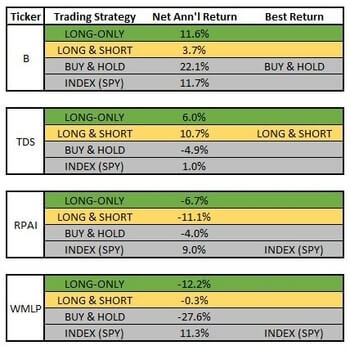
Coincident CCI indicator strategy return comparison – WMLP
After running 4 models under a coincident CCI indicator strategy, indexing isn’t looking so bad. Here are the results so far:
Ralph Lauren Corporation (RL) Results
The model period for RL will be 2/21/12 – 2/21/17.
Long-only and long & short trading strategies – RL
Another disappointing showing for the coincident CCI indicator strategy.
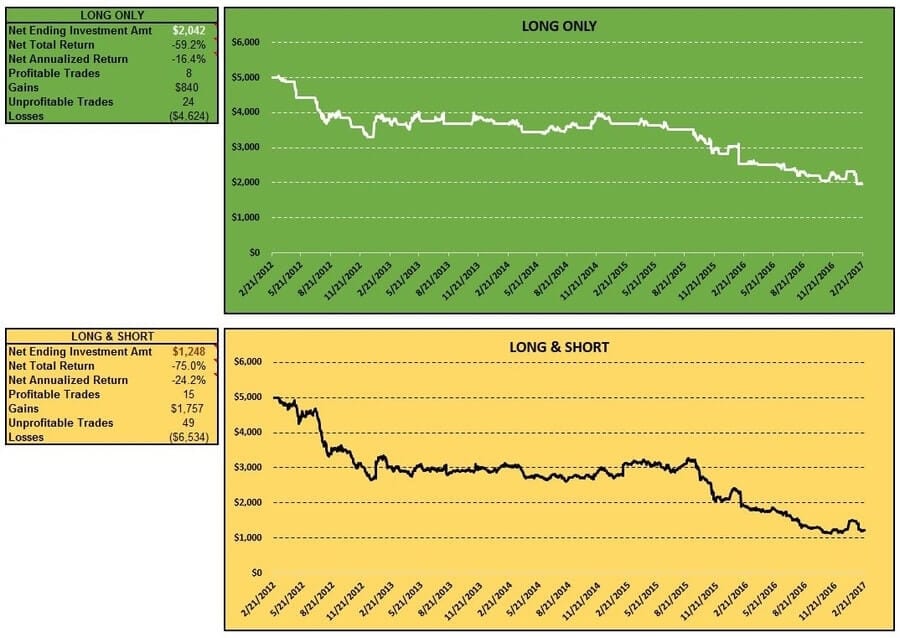
Though not quite as extreme as WMLP, RL performed poorly over the model period. Dropping from the $175 range in Feb 2012 to the $78 range in Feb 2017. As you might expect, the long-only trading strategy performed poorly under these circumstances. Unable to take advantage of any stock price increases over that period. The net annualized return came in at -16.4%. The account value barely got above $5,000. That was early in the model period. It never really showed any promise of making a gain after that. In Sep 2015, the account value really began to tank and continued to fall for the remainder of the model period.
Profitable to unprofitable trades – RL
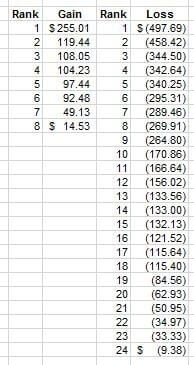
The ratio of profitable (8) to unprofitable (24) trades reflects as much. The trading strategy was rarely correct and when it was, the gains paled in comparison to the losses. Here’s a quick glance at the amounts of the gains and losses:
“C’mon,” you might be thinking, “WMLP was a fluke. RL had to have lots of opportunities for short positions to make money.” That’s a reasonable assumption and with the meteoric fall of the stock price over the model period, there were ample opportunities to make money by going short. The coincident CCI indicator strategy didn’t give timely signals, though. Here’s an example:
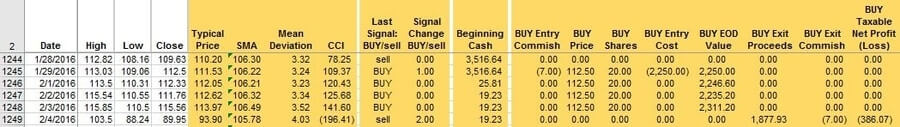
As you can see, the coincident CCI indicator gave a buy signal on 1/29/16. RL actually went up about six points over the next few days. Problem was, the sell signal didn’t come until 2/4/16, the day the bottom fell out of the stock. The CCI indicator is known as a “lagging” indicator and this is why. This is only one example of what went wrong with this trading strategy. It illustrates how it was unable to capitalize on declining prices.
The long & short trading strategy would have provided a trader with even more abysmal losses than the long-only strategy. The net annualized return was -24.2%.
Also, like the long-only, the long & short trading strategy had 3x as many unprofitable trades as profitable ones – 49 to 15 to be exact.
Here are the tables and charts for the long-only and long & short trading strategies:
Buy & hold and indexing investing strategies – RL
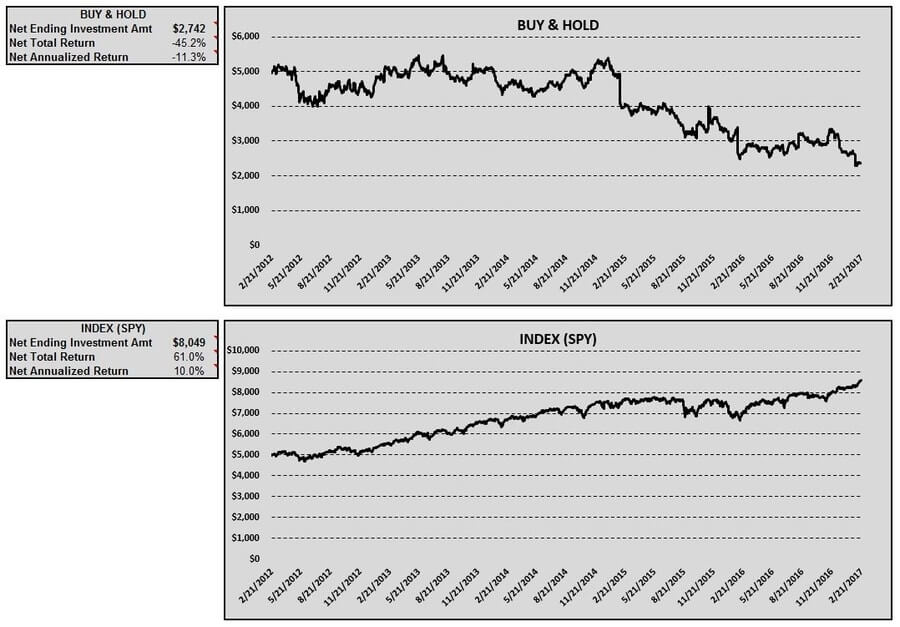
Not unlike the trading strategies, the buy & hold investing strategy spent most of its time in the red. Had the model period ended in early 2015, results would have been very mediocre; but since it stretched another two years, the account value took a sizeable hit. A buy & hold investor would have experienced a net annualized return of -11.3%
Just like we’ve seen with most of the other indexing investing strategies – this was the way to go. Less effort, less stress, greater returns (10.0% net annualized to be exact).
Here’s a look at the buy & hold and indexing tables and charts:
Coincident CCI indicator strategy return comparison – RL
Starting to see a pattern here. This is the third model in a row where indexing was the convincing champ.
Ensco plc (ESV) Results
The model period for ESV will be 10/24/06 – 10/21/11.
Long-only and long & short trading strategies – ESV
So far, the only time a trading strategy (long-only, long & short) has outperformed an investing strategy (buy & hold, indexing) is when the Great Recession hit during the model period. When the market is low-performing, the likelihood of outperforming it would seem to increase by default. A SPY that has risen consistently from 2009 to 2017 isn’t so easy to beat.
Anyhow, since 2008 falls smack dab in the middle of this model, ESV acts similar to TDS and shows that trading strategies can outperform investing strategies (at least in unusual periods like this). The long-only trading strategy doesn’t perform exceptionally well. I had a modest 6.7% net annualized return. It does, however, prompt the trader to sit out a large portion of late 2008 and early 2009, thereby avoiding a lot of ESV’s drop from $82.22 in Jun 2008 to $22.11 in Mar 2009.
Profitable to unprofitable trades – ESV
Profitable and unprofitable trades were pretty even for the long-only trading strategy. The correct call was made 11 times and the incorrect one 12 times.
The long & short trading strategy was able to take advantage of the precipitous drop. Account value increased from $6,183 to $7,274 during this period. Unfortunately, after reaching a peak account value of $11,443 in Jun of 2009, most of the gains were given back. The long & short trading strategy ended the model period with a modest 3.7% net annualized return.
Yes, the long & short trading strategy was able to take advantage of the effects of the Great Recession. The problem was, the signals to short the stock were wrong most of the time. Over the model period, the long & short trading strategy logged 18 profitable trades. There were 28 unprofitable ones. It was these great many incorrect calls on the short side that caused the long & short trading strategy to give back most of its gains.
Here’s a look at the long-only and the long & short tables and charts:
Buy & hold and indexing investing strategies – ESV
Due in part to a healthy run-up early in the model period and a solid recovery after the “Great Recession dip,” the buy & hold investing strategy didn’t have as poor a return as you might have expected. The net annualized return ended up at .4% – essentially flat.
The indexing investing strategy didn’t fare quite as well, posting a modest return of -1.8% net annualized. The SPY recovered a lot of the lost value after bottoming out in early 2009. Like the buy & hold investing strategy.
Here are the buy & hold and indexing tables and charts:
Coincident CCI indicator strategy return comparison – ESV
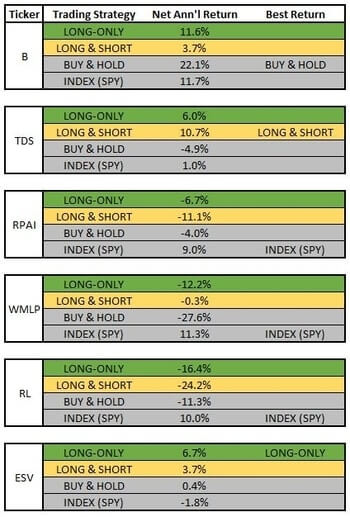
Score one for the traders! Though, considering that the trading strategies only outperformed 1/3 of the time; and when they did, the returns were pretty ho-hum, I suppose there isn’t much to celebrate. Here’s the final comparison of returns for the coincident CCI indicator strategy:
Thoughts on using the CCI to trade stocks from actual traders
Do you use the CCI indicator to trade stocks? If so, what settings do you use?
Yes, I use CCI. 30m chart = CCI(18). Daily = CCI (4). Weekly = CCI(40).
Do you use the CCI in conjunction with another indicator? Which one(s)?
Yes, I use eMA’s to define trend which I use in conjunction with CCI.
Any other thoughts on using the CCI indicator to trade stocks?
“Other thoughts” is fairly broad, but I will add a few things. Construction of CCI matters. CCI compares hi-low-close of current bar to “typical price”. RSI compares average prices. This is a small, but important difference. RSI can move wildly in a single price bar until it closes. CCI is anchored by hi/lo in most cases, so you’re really just waiting for close and it won’t change too much.
I use CCI in 3 ways on 30m charts. 1) Looking for accumulation/distribution spikes in downtrends/uptrends. 2) Using CCI to confirm breakout/breakdown. 3) Buying weak oversold dips in uptrends (or selling weak overbought rips in downtrends). Daily, I mostly just use CCI(4) to alert of oversold conditions. Weekly, I use for big divergences & general o/b or o/s conditions – these can run for long periods and shape the way that I trade 30m charts.
Do you always use a ±100 upper/lower limit?
No, I only use +/-100 on Weekly(40) because it’s slower. I use +/-200 on 30m CCI(18). Daily CCI(4) is bound to +/-133 because of math – again I just use Daily for o/b or o/s with alerts set to +/-133.
What settings (period & upper/lower limit) do you use to trade stocks? Different settings on intraday, daily, weekly charts?
I use the default indicator settings. I only trade the intraday charts currently.
What’s the biggest pitfall to avoid for someone wanting to use the CCI indicator to trade stocks?
The CCI is great for looking at extreme price swings in a security on a lookback period. The greatest issue I see with the indicator like any other momentum oscillator is that it lags price movement. So, if you think the indicator has reached an extreme and open a short, there is no guarantee the price will drop. You have to manage the trade with stops and sound money management rules.
Stocks CCI strategy
First and foremost – don’t put your life savings in this stocks CCI strategy. It was only in periods where market performance was volatile that the trading strategies were able to eek out excess returns. During an extended bull market, this indicator strategy doesn’t seem to offer any value.
A stocks CCI strategy with different settings might have worked better. It might have worked worse too. That’s an experiment for another day.
I’m not convinced that a long & short trading strategy offered enough returns for the risk taken. I can’t quite pinpoint why it worked so well with TDS and so poorly with ESV.
If I had only two choices for investing style: indexing and the coincident CCI indicator strategy I would choose indexing. Less work, typically better returns. But…it should be noted that the best return of all the strategies tested (by far) was buying & holding the right stock. How to go about finding the “right” stock is also a topic for another time.
Also, check out my posts where I backtest the coincident CCI indicator strategy with Forex and commodities.
Join the conversation on Twitter!
Contents
- Barnes Group Inc. (B) Results
- Telephone and Data Systems, Inc. (TDS) Results
- Retail Properties of America, Inc. (RPAI) Results
- Westmoreland Resource Partners, LP (WMLP) Results
- Ralph Lauren Corporation (RL) Results
- Ensco plc (ESV) Results
- Thoughts on using the CCI to trade stocks from actual traders
- Stocks CCI strategy