Download the Sales vs Inventory spreadsheet
Complete the form below and click Submit.
A link to the Google Sheet will be emailed to you.
Once you’re in the spreadsheet, click on File > Make a copy to edit. I’ll no longer be responding to “Requests for access.”
How do you calculate ROI on inventory? Video summary
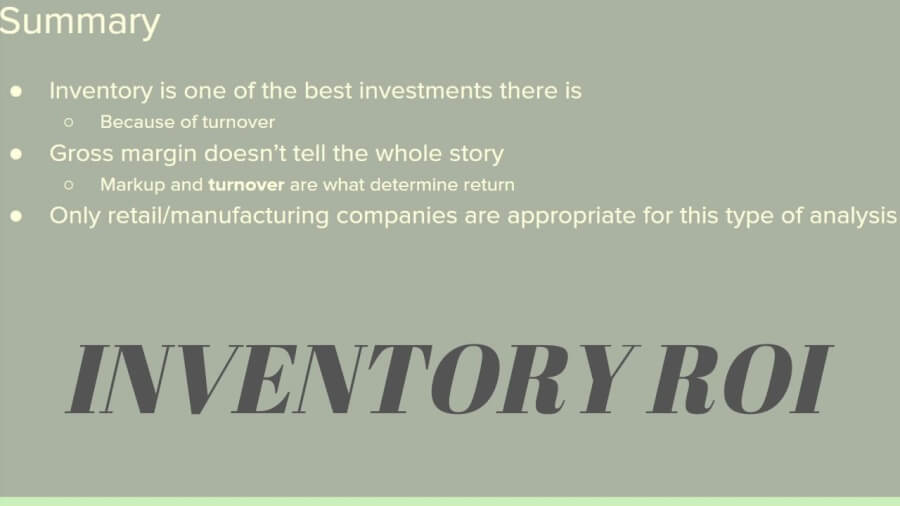
Inventory is one of the best investments there is. That is, if it is being turned over frequently.
Gross margin isn’t necessarily representative of the return earned on inventory. Markup and turnover are what actually determine ROI.
This type of analysis isn’t for every company. It’s only appropriate for retail or manufacturing companies. Companies that hold significant amounts of inventory.
An (unrealistic) example of inventory ROI
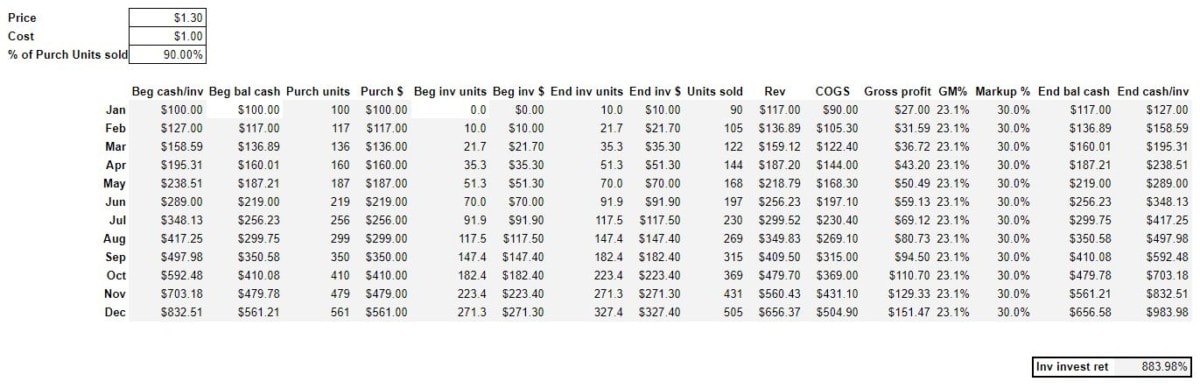
Consider a retail startup with $100 in capital.
They are selling one solitary item for $1.30. It cost them $1.00 (COS).
Here’s what happens over the course of 1 year:
With their $100 in capital, they buy 100 units in January. For every unit they sell, they reinvest all gross profit in inventory – e.g. they buy more units.
Let’s assume that they sell 90% of the units they purchase in a month.
What would this startup’s return be?
30%? More? Less?
How to analyze revenue and inventory with a real-life example
Let’s look analyze a real-life company – Target Corporation (TGT)
What can we learn from changes in:
Inventory?
Revenue?
COGS (COS)?
Let’s see what Target’s ROI on their inventory was.
Step 1 – Determine inflation
First of all, know that this isn’t going to be exact. That’s okay.
Why do we need data about inflation? Because it gives us an idea of the change in Unit cost and the COGS (COS).
So, where to find quality inflation information?
Here’s your best source.
Other sources exist but definitely start looking here.
Step 2 – Enter beginning inventory balance
The beginning inventory balance will be, of course, the same as the ending inventory balance for the quarter before the analysis begins.
For example, look up the ending inventory balance for Q1, in order to find the Beginning inventory $ for Q2.
Refer to SEC Form 10-Q, 8-K, or 10-K to find inventory balances.
Step 3 – Enter all the other givens
These include:
Ending inventory $
Revenue
Cost of Goods Sold (COGS)/Cost of Sales (COS)
All of these can, too be found in SEC Form 10-Q, 8-K, or 10-K.
Step 4 – Simulate unit cost
To be clear, this is, what we’ll call, an “indexed cost.” It’s not any sort of actual cost. Target sells thousands and thousands of diverse items. It would be impossible to know what the weighted-average cost of all those items was.
For the purposes of this analysis (and simplicity’s sake), we’re assuming that Target sells one item. And the cost of that item at the beginning of our analysis is $100.
From there, we’ll see what changes take place with this indexed cost, due to what was entered in the Unit cost change (inflation) field.
Using this indexed cost, allows us to estimate changes in inventory valuation and prices.
Step 5 – Inventory analysis
Beginning inventory quantity = Beginning inventory $ ÷ Unit inventory cost
Now, I have to backtrack a bit. Earlier, I told you that Beginning inventory $ should always equal the previous period’s Ending inventory $. And that’s true. But, since Unit inventory cost changes every period due to the effects of Unit cost change (inflation), they won’t be exactly equal. But, they should be close enough.
Here’s how the rest of the inventory analysis equations are calculated:
Purchase quantity = Quantity sold + Ending inventory quantity – Beginning inventory quantity
Purchase $ = Purchase quantity × Unit cost
Ending inventory quantity = Ending inventory quantity ÷ Unit cost
Ending inventory $ is entered manually. From the SEC data.
Step 6 – Gross profit analysis
Here, we’ll use the information we’ve compiled/calculated thus far to get a more detailed breakdown of Target’s gross profit.
Let’s start by estimating the Quantity sold. Again, like Unit cost this is only an index, of sorts, to estimate if quantities have risen or fallen.
Quantity sold = Revenue ÷ Unit price
How do we estimate a “dummy” Unit price to compare to the Unit cost?
Unit price = Unit cost × (1 + Markup %)
Markup % is addressed below.
Unit cost changes depending on the rate of inflation used. It was addressed above.
Revenue and Cost of Goods Sold, like Ending inventory $, comes from SEC Forms.
Gross profit = Revenue – Cost of Goods Sold
Gross margin % = Gross profit ÷ Revenue
Markup % is, kind of, the inverse of Gross margin %.
Markup % = Gross profit ÷ COGS
Inventory turnover, as mentioned earlier, is critical for earning a higher ROI on inventory. The more inventory turns over, the greater the effects of compounding.
Inventory turnover = Cost of Goods Sold ÷ average inventory $
Average inventory $ is simply the average of Beginning inventory $ and Ending inventory $.
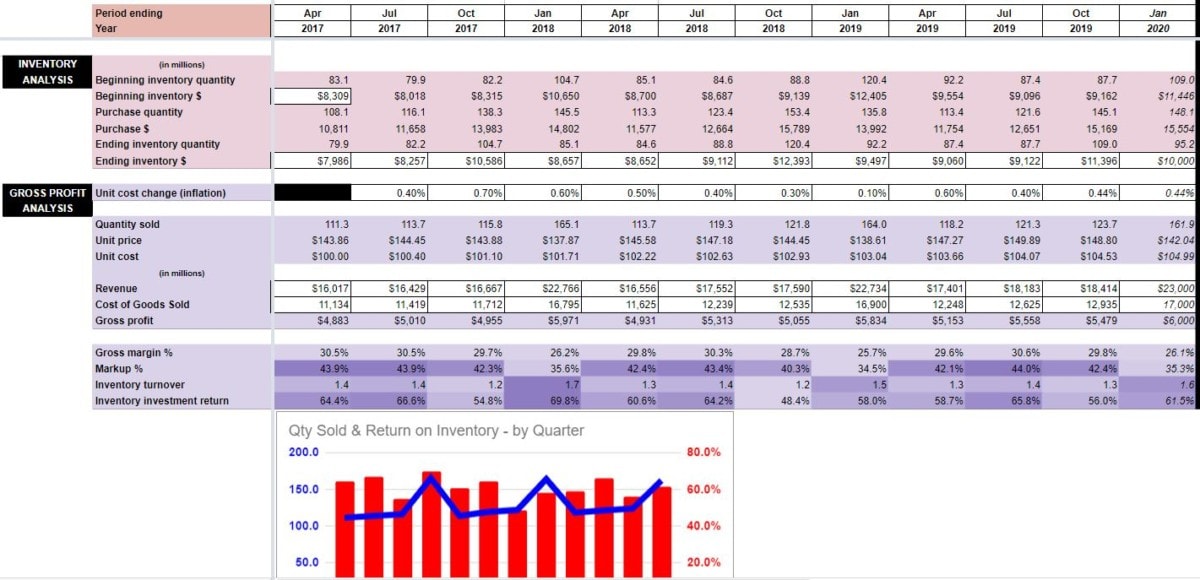
ROI for inventory calculation
Finally, we come to Inventory investment return. Here, we’re looking at cumulative effects of the Markup % (the return earned on the average piece of inventory) and Inventory turnover (how often it’s compounded).
Keep in mind that Inventory investment return is only a ratio, so to speak, not an exact return. It won’t match the unrealistic return outlined above.
But, higher is definitely better. A higher Inventory investment return means that the company is turning its inventory over more often and earning healthy margins. It also means that it’s likely not holding on to excess amounts of “dead” inventory.
Inventory investment return = (1 + Markup %) ^ Inventory turnover – 1