“What is the formula for dividends?”
- Dividend yield = Previous 12 months of dividends ÷ Current stock price
- Total dividend growth = (Current dividend amount ÷ Previous dividend amount) – 1
- Dividend payout ratio = (Previous 12 months of dividends × Basic avg shares outstanding) ÷ Net profit available to common shareholders
- Dividend income = Shares purchased × Previous 12 months of dividends × (1 + Dividend growth rate) ^ Years held
Dividends are a tangible means of growth for investors. Capital gains are great, but dividends put cash in investors’ hands; not promises. In order to get the most out of your dividend investing, you need to pick the right dividend stocks.
How do you pick the right dividend stocks?
By performing the right analyses on a company’s dividends.
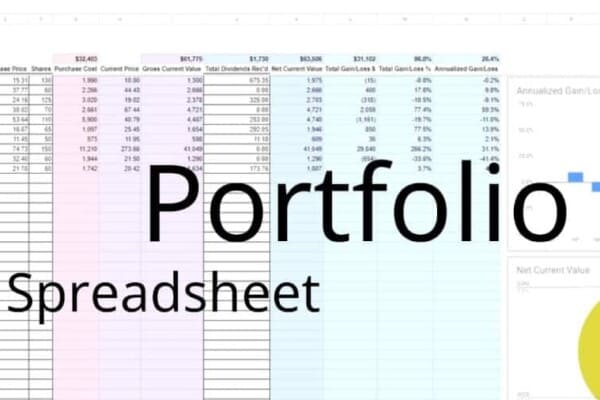
Utilizing some simple formulas in Excel, you can get a better understanding of dividend yields, growth, payout, and income. Each calculation looks at dividends through a different lens – facilitating better dividend investing decisions.
Don’t copy in Excel – download the spreadsheet here
Complete the form below and click Submit.
A link to the Google Sheet will be emailed to you.
Once you’re in the spreadsheet, click on File > Make a copy to edit. I’ll no longer be responding to “Requests for access.”
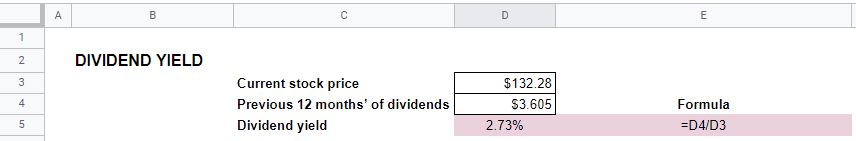
Calculating dividend yield in Excel
Previous 12 months’ of dividends ÷ Current stock price
The dividend yield tells you what annual return you can expect from dividends. That is, if you purchase a stock at the current price. It makes no assumptions about dividend growth, however. It is just a snapshot of the present.
The dividend yield calculation gives you an idea of the income you can earn by buying a particular stock. Hopefully, in the future, dividends will increase. If they do, your cost won’t change, of course. This means that your dividend yield will continue to increase.
Calculating the Dividend yield in Excel is easy.
In cell D3, you’ll see a Current stock price of $132.20.
In cell D4, a Previous 12 months’ of dividends of $3.605.
The formula to calculate dividend yield, therefore, is =D4/D3.
Based on the variables entered, this results in a Dividend yield of 2.73%.
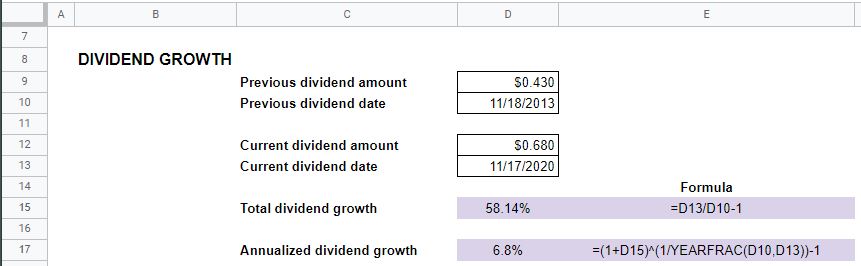
Calculating dividend growth in Excel
(Current dividend amount ÷ Previous dividend amount) – 1
Using Excel to calculate dividend growth can give you an idea of how the dividend yield might increase in the future. Granted, it looks to the past, and that’s no guarantee of the future. But, it can hopefully give you some insight into what the future might hold.
Obviously, a reasonable and sustainable dividend growth rate is preferable. It means that your initial investment earns an ever-increasing amount of income.
In order to calculate dividend growth, you want to take a look at two points in the past. Look back as far as you like, and enter the dividend amount at that time. In the example, this is in cell D9.
Also, enter the date that dividend was paid in cell D10.
Conversely, enter the end date for the period you want to analyze in cell D13. Then, the per-share dividend amount for that date in D12.
There are two ways to look at dividend growth.
The first is the Total dividend growth over the period you’re analyzing. In the example, this is done with a formula that takes D13 divided by D10 and then subtracts 1 to give us the change in dividend amounts.
This is good to know, but, you also want to know the Annualized dividend growth rate, right?
This formula is a little more complicated.
First of all, you’ll want to add 1 to the recently calculated Total dividend growth rate.
Then, you’ll want to take that amount to the power of 1 divided by a function that will tell us the exact number of years between the dates (to the decimal). That function is called YEARFRAC. All the YEARFRAC formula needs are the Previous dividend date and the Current dividend date.
You’ll close both of those previous parentheses, and then subtract 1 to come up with the actual Annualized dividend growth rate.
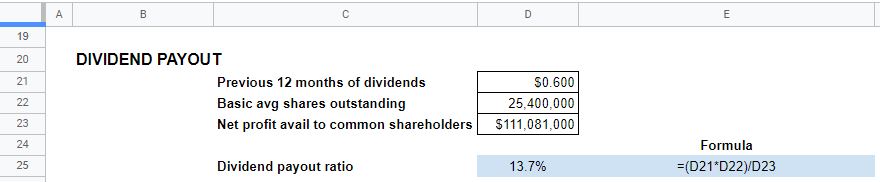
Calculating the dividend payout ratio in Excel
(Previous 12 months of dividends × Basic avg shares outstanding) ÷ Net profit available to common shareholders
Calculating the dividend payout ratio in Excel looks at things from the company’s perspective, not the investors’. The dividend payout ratio is the percentage of net profit that was paid in dividends.
The dividend payout ratio gives investors an idea of how much profit the company is returning to them. There’s no good, bad, or indifferent threshold for a dividend payout ratio. It’s up to the investor to decide if enough earnings are being returned to the shareholders. Also, if that which is being reinvested in the company is earning an adequate return.
The Previous 12 months of dividends go into cell D21. In this example, that amount is $.600.
Basic average shares outstanding is entered into cell D22. That amount is 25.4 million, in the example.
Finally, the Net profit available to common shareholders is entered in D23. $111.081 million here.
To calculate the Dividend payout ratio, you first need to figure the total amount of dividends paid. That’s done by multiplying the Previous 12 months of dividends by the Basic average shares outstanding.
Then, the dividends paid is simply divided by Net profit available to common shareholders to determine the Dividend payout ratio.
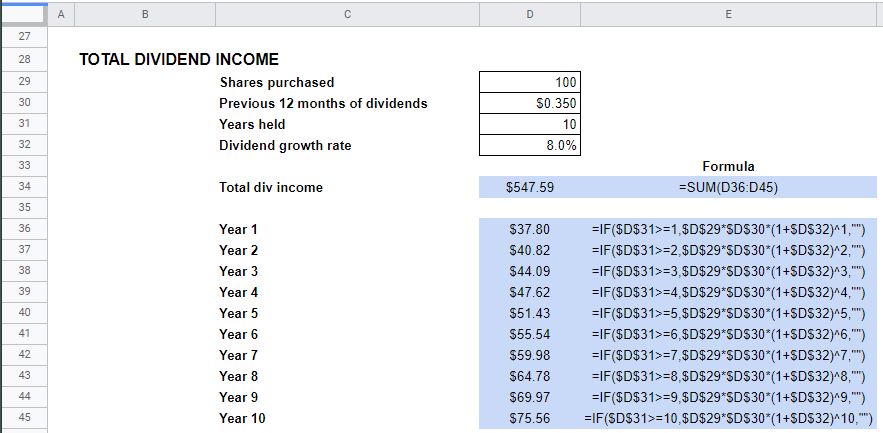
Calculating total dividend income in Excel
Shares purchased × Previous 12 months of dividends × (1 + Dividend growth rate) ^ Years held
Investing is about making money. So, dividend investing is about knowing how much dividend income you can expect to make. The total dividend income calculation simply estimates and totals all the dividends you expect to collect from a given stock.
The total dividend income calculations tell you how much you can expect to earn based on how long you expect to own the shares and at what rate you think the dividend will grow.
A stock that pays a modest dividend now might be more attractive if it’s expected to grow rapidly, correct?
Here are the variables:
Share purchased go in cell D29
Previous 12 months of dividends in cell D30
The number of years you expect to own the stock (Years held) in cell D31
Finally, the Dividend growth rate in D32
Since the dividend is expected to grow, the dividends received will be different for every year and will need to be calculated separately.
This is done by copying 10 formulas that will have to be tweaked individually.
Starting in cell D36, you’ll use an IF function. This will ensure that dividends are not calculated for any year you don’t expect to own the stock (e.g. Year 6 if you only expect to hold it for five years).
The IF function looks to see if the Years held is greater than or equal to the Year number. If it is, Shares purchased are multiplied by the Previous 12 months of dividends.
That amount is then taken times 1 + the Dividend growth rate. Which, in turn, is taken to the power of the Year number. Doing this applies the effects of compounding.
Once that formula is entered in cell D36, copy it down through D45.
Work your way through each formula and change the number after “>=” and “^” to match the Year number.
For example, Year 2 is “>=2” and “^2”, Year 3 is “>=3” and “^3”, and so on…
Now, all you need to do is total the dividend income for Years 1-10. That is done by using the SUM function in cell D34.
What is the formula for dividends?
These formulas will help you perform some quick analyses in Excel to aid in understanding the dividend stock you’re analyzing.
Future dividends are always uncertain. However, most of these formulas depend on historic data. So, take whatever conclusions you draw from these Excel calculations with a grain of salt.
You are now, surely, better armed with information to make a quality dividend stock investment decision.