“Why bother calculating financial ratios?” Financial ratios are used by investment analysts to put financial statements into context. Financial ratios simplify the financial statements, which in turn makes the information easier to understand. On any public company‘s financial statements you’ll find a lot of very large numbers. It’s difficult to know whether those numbers are good, bad, or so so, without having something to compare them to.
That’s what most financial ratios are. Simply a comparison of one number to another.
Some more advantages of financial ratio analysis
Analyzing financial ratios helps the investor compare the financial performance of different companies. Particularly, if you do as I advise, and focus most of your efforts within a few industries. Becoming an expert in those industries will make comparisons more meaningful. You’ll have a better understanding of what good, bad, and ordinary. It’s also beneficial because, over time, you’ll begin to learn which financial ratios are most important for your industry.
Financial ratios can also be compared intra-company. This is done by reviewing the financial ratios of the same company over time. Are they improving, or are they deteriorating? Knowing this will help you forecast financial statements into the future and make more accurate valuations in the present.
Another critical benefit of financial ratios for an intra-company analysis is the ability to size up a company’s solvency. A company declaring bankruptcy is bad news for existing shareholders. Certain financial ratios facilitate the ability to understand the potential risk of insolvency. Though, there are some limitations to this…
Disadvantages of financial ratio analysis
While, overall, financial ratio analysis is beneficial, it is not a silver bullet for foolproof investing.
The most glaring shortcoming of financial ratios is that they are past information. As mentioned earlier, they facilitate the forecasting of financial information, sure. But, they are, by design, old news. Therefore, not necessarily indicative of future performance.
Furthermore, because of their simplicity, financial ratios lack nuance. Accounting policies may differ among companies. Even those in the same industry. Also, there may be other qualifying factors at play that make for apples-to-pears or apples-to-oranges comparisons.
Types of financial ratios
There are a lot of different financial ratios. In fact, all it takes to create a financial ratio is to take one number and divide it by another. However, dividing any two random numbers from a financial statement doesn’t necessarily provide valuable information.
So, below I’ll address some of the most important and widely used financial ratios. They’ll be grouped into five general categories.
Examples (from the most recent fiscal year, as of August 2020) will be provided for each ratio. Note how widely ratios can vary – even for companies in the same industry!
All data pulled from Yahoo! Finance. Dollar amounts are in millions unless otherwise noted. Dollar amounts not in USD, also noted.
Profitability ratios
Profitability is the goal of every business. Generally, the more profit, the better. Profitability ratios are great because they examine what it took to earn that profit. For instance – how much in sales? How much in assets?
Generally, the higher the better here. It means that a company earns more with less.
All of these ratios are expressed as percentages.
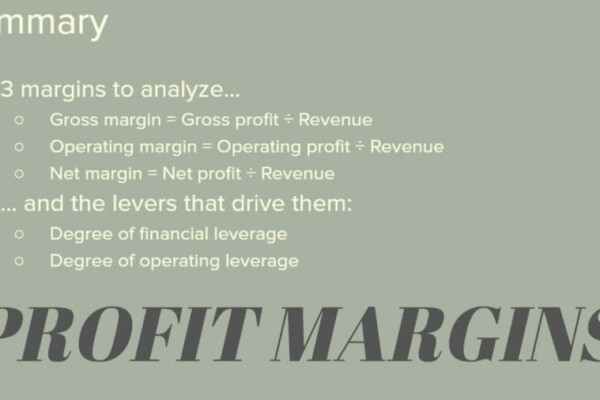
Gross, operating, and net profit margins
Gross margin = gross profit ÷ revenue
Operating margin = operating profit ÷ revenue
Net margin = net profit ÷ revenue
Profit margins are important because they show how much revenue is making its way to the bottom line. Put another way, which types of costs are preventing sales from being turned into profit?
Read more about profit margin analysis here.
| Revenue | Gross Profit | Gross Margin | Op profit | Op margin | Net Profit | Net Margin | |
|---|---|---|---|---|---|---|---|
| Simon Property Group Inc (SPG) | $5,755 | $4,734 | 82.3% | $2,908 | 50.5% | $2,423 | 42.1% |
| SITE Centers Corp. (SITC) | $507 | $367 | 72.4% | $128 | 25.2% | $102 | 20.1% |
| Boston Properties, Inc. (BXP) | $2,961 | $1,866 | 63.0% | $1,048 | 35.4% | $652 | 22.0% |
Return on assets (ROA)
Return on assets = net profit ÷ total assets
The benefit of the ROA ratio is that it tells you how effectively the company invests its money into assets. A higher number means that they earn more profit on their asset investments.
A negative ROA is the result of negative net profit. Assets will never be negative.
| Net Profit | Total Assets | ROA | |
|---|---|---|---|
| Kohl’s Corporation (KSS) | $691 | $14,555 | 4.7% |
| Dillard’s, Inc. (DDS) | $111 | $3,430 | 3.2% |
| Macy’s, Inc. (M) | $564 | $21,172 | 2.7% |
Return on equity (ROE)
Return on equity = net profit ÷ shareholder’s equity
The ROE ratio is great because it tells you the rate of return shareholders are earning annually on their investment in the company. The higher the number, the better the return.
A negative ROE can be the result of negative profit or negative shareholder’s equity – as seen in the examples below.
| Net Profit | Shareholder’s Equity | ROE | |
|---|---|---|---|
| Yum! Brands, Inc. (YUM) | $1,294 | -$32,976 | -16.3% |
| The Wendy’s Company (WEN) | $137 | $648 | 21.1% |
| McDonald’s Corporation (MCD) | $6,025 | -$6,258 | -96.3% |
Efficiency ratios
These are some of my favorite ratios because they show how competently the day-in-day-out operations of the business are being run. The benefit of calculating these ratios is that it gives some insight into how effective management is. This might include upper management, operations management, or accounting management.
These are ratios where all things being equal, extremes are better. These ratios are expressed as numbers. Whether the number should be high or low – depends on the ratio. A high asset turnover ratio is desirable. But, a high degree of operating leverage might not be.
For every efficiency ratio you’ll want to consider why the outliers are they way they are.
Asset turnover ratio
Asset turnover ratio = revenue ÷ average total assets
ROA looked at how efficiently a company used its assets. So does the asset turnover ratio. It just looks at it from a different perspective. The effects of costs are taken out and only revenue is considered. An average of total assets can be used to “smooth out” the effects of any year-end manipulation. In the examples below, year-end amounts are used.
A benefit of the asset turnover ratio is that it will tell you how efficiently the company is using its (probably pricy) assets to generate revenue.
Every asset is considered from cash, inventory, to fixed assets. Of course, fixed assets, by nature aren’t as dynamic as current assets. So, you would assume that they drag down the asset turnover ratio. However, if they’re good investments, they should earn a lot of revenue.
The asset turnover ratio can be broken down further into the accounts receivable, inventory, and fixed asset turnover ratios.
| Revenue | Total Assets | Asset Turnover Ratio | |
|---|---|---|---|
| eBay Inc. (EBAY) | $10,800 | $22,819 | 0.5 |
| Alibaba Group Holding Limited (BABA) | 509,711 | 1,312,985 | 0.4 |
| Wayfair Inc. (W) | $9,127 | $1,891 | 4.8 |
Inventory turnover ratio
Inventory turnover ratio = cost of goods sold (COGS) ÷ average inventory
Note that the formula uses average inventory. Generally, this is estimated by averaging the beginning and ending inventory balances. An average is used to prevent extreme fluctuations in inventory from affecting the ratio.
Companies need enough inventory to satisfy the ebbs and flows of demand. Any more than that is just a waste of money. $10 million in inventory sitting on a shelf is no different than $10 million in cash sitting on a shelf. It’s just taking a different form.
Calculating the inventory turnover ratio is important if you’re analyzing manufacturers and retailers. For these companies, a significant amount of money is tied up in inventory. It’s important that their inventory work for them.
The benefit of measuring inventory turnover is that it shows how effectively a company purchases and builds products for its customers. The higher this number, the better. Again, as long as customers aren’t getting stiffed.
| COGS | Average Inventory | Inventory Turnover Ratio | |
|---|---|---|---|
| Dell Technologies Inc. (DELL) | $63,221 | $3,465 | 18.3 |
| HP Inc. (HPQ) | $47,586 | $5,898 | 8.1 |
| Cisco Systems, Inc. (CSCO) | $19,238 | $1,615 | 11.9 |
Accounts receivable (AR) turnover ratio
AR turnover ratio = revenue (net credit sales) ÷ average AR
The AR turnover ratio, technically, should use the amount of sales made on credit as the numerator. That information is not always available, however.
So, revenue can be used instead. But, it would be best if you knew that most sales were made on credit. Also, note that average AR is used in the denominator too. For the same reason, an average was used in the inventory turnover ratio.
The benefit of calculating this ratio is that it tells you about the company’s collection efforts. Sales are great. But, if it’s hard (or impossible) to collect cash from customers, then they can be detrimental. Again, cash is the lifeblood of a business.
On that same token, the AR turnover ratio also sheds light on the quality of the company’s customers. Good customers pay within their terms and pay everything they owe.
| Revenue | Average AR | AR Turnover Ratio | |
|---|---|---|---|
| Ford Motor Company (F) | $155,900 | $64,218 | 2.4 |
| General Motors Company (GM) | $115,786 | $33,399 | 3.5 |
| Toyota Motor Corporation (TM) | $29,930 | $8,865 | 3.4 |
Fixed asset turnover ratio
Fixed asset turnover ratio = revenue ÷ average fixed assets (property, plant, & equipment, PPE)
The fixed asset turnover ratio is the final piece of the puzzle in the breakdown of asset turnover.
The benefit of this ratio is understanding how effectively PPE is employed to generate sales. It’s of particular interest if you’re analyzing a manufacturing company. Because, of course, they’re especially reliant on land and machinery to create their products.
Like the inventory and AR turnover ratios, an average is used to mitigate the effects of any big increases/decreases in fixed assets.
| Revenue | Average PPE | Fixed Asset Turnover Ratio | |
|---|---|---|---|
| Amazon.com, Inc. (AMZN) | $280,522 | $79,822 | 3.5 |
| Walmart Inc. (WMT) | $523,964 | $119,222 | 4.4 |
| Target Corporation (TGT) | $78,112 | $28,009 | 2.8 |
Degree of operating leverage (DOL)
Degree of operating leverage = % change in operating profit ÷ % change in revenue
I’ve covered DOL previously on this site and on its sister site SpreadsheetsForBusiness.com.
I cover it so often because it’s an important concept.
DOL is beneficial to know because it’s a guide for how much you can expect operating profit to change due to a change in revenue.
In other words – how effectively is the company using its fixed costs?
For example, a DOL of 1.50 means that a 10% increase in revenue would be expected to increase operating profit by 15% (10% × 1.50). The opposite is also true. A 10% decrease in revenue would be expected to result in a 15% decrease in operating profit.
| Change in Revenue | Change in Op Profit | Degree of Op Leverage | |
|---|---|---|---|
| Microsoft Corporation (MSFT) | 13.6% | 23.3% | 1.7 |
| Oracle Corporation (ORCL) | -1.1% | 1.3% | -1.2 |
| SAP SE (SAP) | 11.5% | -2.1% | -0.1 |
Degree of financial leverage (DFL)
Degree financial leverage = operating profit ÷ (operating profit – interest expense)
I’ve also covered DFL in-depth on this site and on SpreadsheetsForBusiness.com.
The benefit of calculating DFL is that it will tell you how well the company is employing the funds it borrows. Interest is a fixed cost just like fixed COGS or SGA costs. It’s subtracted from revenue, however, after operating profit is calculated. So it’s not included in the DOL calculation.
The principle is the same, however. A DFL of 1.50 means that a 10% change in operating profit would increase net profit by 15% (1.50 × 10%). As you might expect, the opposite is also true. A 10% decrease in operating profit is amplified to a 15% decrease in net profit.
| Operating Profit | Op Profit – Interest Expense | Degree of Financial Leverage | |
|---|---|---|---|
| Microsoft Corporation (MSFT) | $52,959 | $50,368 | 1.1 |
| Oracle Corporation (ORCL) | $14,202 | $12,207 | 1.2 |
| SAP SE (SAP) | 5,603 | 5,014 | 1.1 |
Liquidity ratios
Cash is the lifeblood of business. Liquidity ratios convey how much cash (or liquid assets) the company has on hand to pay liabilities. Specifically, current (due within a year) liabilities.
It’s good to calculate these ratios so you know if your company is doing “good enough” in terms of liquidity. All you’re looking for is the ability to meet short-term obligations. Having a current ratio of 10.0 doesn’t imply financial health. It implies a hoarding of current assets and a lack of investment savvy.
All of the liquidity ratios are expressed as numbers. Hopefully, numbers that are greater than 1.0.
Current ratio
Current ratio = current assets ÷ current liabilities.
The current ratio asks the simple question – can this company pay all of its current liabilities with the current assets it has on hand? This is important to know because those current liabilities are due in the near future and you want to be sure that the company can cover them.
| Current Assets | Current Liabilities | Current Ratio | |
|---|---|---|---|
| The Procter & Gamble Company (PG) | $27,987 | $32,976 | 0.8 |
| Colgate-Palmolive Company (CL) | $4,179 | $4,038 | 1.0 |
| The Clorox Company (CLX) | $2,020 | $1,440 | 1.4 |
Quick ratio
Quick ratio = (current assets – inventory) ÷ current liabilities
You’ll notice how similar the quick ratio is to the current ratio. The difference being that inventory is no longer considered when examining a company’s ability to pay current liabilities. This is because inventory isn’t always easy to sell. Some might be obsolete. Or, there might not be adequate demand for all of the inventory a company holds.
That’s the benefit of the quick ratio – it is a more conservative measure of liquidity.
The quick ratio isn’t appropriate for every company you analyze. Not every company carries inventory. For those that do – the quick ratio will always be less than the current ratio
| Current Assets – Inventory | Current Liabilities | Quick Ratio | |
|---|---|---|---|
| Exxon Mobil Corporation (XOM) | $31,524 | $63,989 | 0.5 |
| ConocoPhillips (COP) | $15,887 | $7,043 | 2.3 |
| Chevron Corporation (CVX) | $22,481 | $26,530 | 0.8 |
Cash ratio
Cash ratio = cash and equivalents ÷ current liabilities
Now we’ve stopped beating around the bush. We’re only interested in seeing if a company can pay most (all?) of its current liabilities with the cash it has on hand. Accounts receivable (AR) and other current assets have been stripped out. AR might not always be recoverable. Or, the company might have to settle for less than anticipated. Cash is cash, though.
Stripping out AR and the other current assets will always make the cash ratio lower than the quick and current ratios.
The benefit of this ratio is that it’s a hyper-conservative measure of liquidity.
| Cash & Equivalents | Current Liabilities | Cash Ratio | |
|---|---|---|---|
| Under Armour, Inc. (UAA) | $788 | $1,422 | 0.6 |
| NIKE, Inc. (NKE) | $8,348 | $8,284 | 1.0 |
| Lululemon Athletica Inc. (LULU) | $1,094 | $620 | 1.8 |
Solvency ratios
Whereas liquidity ratios focused on short-term liabilities, solvency ratios are concerned more with long-term liabilities. The benefit of calculating solvency ratios is that it can help you understand how much of assets are financed with debt vs equity.
Debt is not necessarily bad. If it’s cheap and if the company can invest the proceeds in such a way as to earn a superior return, then borrowing is fine. Look at it this way – if the company can borrow at 5% and use the proceeds to fund a project that has a return on investment of 25%, then you would want them to borrow as much as possible. On the other hand, if they’re borrowing long-term to make payroll – then that’s probably a problem.
So, whether a solvency ratio should be high or low depends on the ratio and it depends on the company. Generally speaking, a company should employ leverage to the extent that they can invest it profitably and cover the cost of borrowing.
Debt ratio
Debt ratio = total liabilities ÷ total assets
The debt ratio is pretty straightforward. It tells you what percentage of assets are financed with debt. The benefit of calculating this ratio is that it shows you how conservative a company is and/or how compelling it feels it’s investment options are.
Debt is also important when valuing stock because of its effect on enterprise value and net cash. The Detailed Stock Valuation Spreadsheet post goes into more detail on this. Just know that more debt will increase a company’s enterprise value and will decrease its total value per share. This is because more money is required to have complete control of the company.
| Total Liabilities | Total Assets | Debt Ratio | |
|---|---|---|---|
| The Kroger Co. (KR) | $36,683 | $45,256 | 81.1% |
| Albertsons Companies, Inc. (ACI) | $22,457 | $24,735 | 90.8% |
| Costco Wholesale Corporation (COST) | $29,816 | $45,400 | 65.7% |
Debt to equity ratio
Debt to equity ratio = long-term liabilities ÷ total equity
The debt to equity ratio is another way to look at how assets are financed.
Liabilities can take many different forms. So, you might see different people using different formulas. For simplicity’s sake, here on ISM, I’ll only use long-term liabilities in the numerator. Others will use total liabilities or only “debt.” Whatever formula you decide to use for your analysis doesn’t matter all that much as long as you are consistent when you’re making historical and inter-company comparisons.
Like the debt ratio, the debt to equity ratio is great for shedding light on the conservatism of management. It also conveys a company’s ability to cover debt with equity, in the event of an emergency. Because short-term liabilities like accounts payable and deferred revenue are not factored in, the debt to equity ratio might shed a little more light on management’s capital mix philosophy than the debt ratio.
| Long-Term Liabilities | Total Equity | Debt to Equity Ratio | |
|---|---|---|---|
| Netflix, Inc. (NFLX) | $19,538 | $7,582 | 2.6 |
| Comcast Corporation (CMCSA) | $149,248 | $82,726 | 1.8 |
| DISH Network Corporation (DISH) | $17,171 | $11,565 | 1.5 |
Times interest earned (TIE) ratio
Times interest earned ratio = operating profit ÷ interest expense
Thus far, all of the solvency ratios have focused on the balance sheet. However, it’s the income statement that affects stock valuation most of all. The TIE ratio, like DFL, highlights the effects of fixed interest payments on net profit.
The benefit of calculating the TIE ratio is that it lets you know what kind of “margin of safety” the company has beyond its interest expenses. This ratio is expressed as a number and generally, higher is considered better. However, too high of a TIE ratio might mean that the company isn’t employing leverage to its full effect. If that’s the case, hopefully it’s paying most of that income out in dividends.
| Operating Profit | Interest Expense | TIE Ratio | |
|---|---|---|---|
| Verizon Communications Inc. (VZ) | $131,868 | $4,730 | 27.9 |
| AT&T Inc. (T) | $181,193 | $8,422 | 21.5 |
| T-Mobile US, Inc. (TMUS) | $5,722 | $1,135 | 5.0 |
Market ratios
If you weren’t familiar with some of the other ratios, you’re probably familiar with these. They’re often the first thing you see when you look up a stock quote. Though they are thought of as market ratios, for the most part, they’re still within the company’s control. The P/E ratio and dividend yield being the exceptions because of the effect of the company’s stock price on the ratio.
Most of these ratios, you would prefer to be higher than lower. The P/E ratio, again, being the exception.
Earnings per share = net profit available to common shareholders ÷ basic average shares
EPS is beneficial to know because it puts a company’s net profit into context. $1 billion in net profit sounds great. And, it is – if the company only has 1,000 shares outstanding. It’s not as great if they have 500 billion shares outstanding.
Of course, earnings per share requires its own context. Which the P/E ratio (below) helps to provide.
Note the use of the phrase “available to common shareholders” in the formula. Income statements all tend to look generally the same. There are always some company/industry-unique line items worked into there, however. So, just be mindful that you’re using the correct numerator.
As far as the denominator goes, the average number of shares is used to account for any issuing or buyback of shares that might have taken place throughout the quarter/year. This information should be provided and not need to be calculated.
You’ll also often see diluted EPS amounts. Diluted EPS factors in convertible securities (employee stock options, etc.) that could be exercised and would, therefore, dilute the existing number of shares.
A higher EPS is always good. Those usually come with higher prices, however.
| Net Profit Available to Common Shareholders | Basic Average Shares Outstanding | EPS | |
|---|---|---|---|
| Apple Inc. (AAPL) | $55,256 | $4,618 | $11.97 |
| Motorola Solutions, Inc. (MSI) | $868 | $167 | $5.21 |
| BlackBerry Limited (BB) | -$152 | $554 | -$0.27 |
P/E ratio
P/E ratio = stock price ÷ EPS
The P/E ratio provides some context to EPS. It tells you what you have to pay to get the company’s EPS. Oftentimes, you have to pay many times the stock’s EPS.
Conceptually, you can think of the EPS as the number of years it would take you to “breakeven” on a stock (at the current level of earnings). For instance, if a stock is priced at $10, has an EPS of $1, then the P/E ratio is 10.0, of course. Paying $10 now for something that (again, conceptually) will pay you back $1 per year will take 10 years for you to breakeven.
This is why some stocks might have a higher P/E ratio. If the consensus is that they’ll grow quickly and EPS will increase, then the payback period would be shorter.
The benefit of calculating the P/E ratio is that it provides you with a quick and easy way to compare pricing among different companies.
| Stock Price | Earnings Per Share | P/E Ratio | |
|---|---|---|---|
| Apple Inc. (AAPL) | $446.47 | $11.97 | 37.3 |
| Motorola Solutions, Inc. (MSI) | $142.33 | $5.21 | 27.3 |
| BlackBerry Limited (BB) | $4.88 | -$0.27 | -17.8 |
Dividend yield
Dividend yield = annual dividend ÷ stock price
Technically, all company earnings are for shareholders. They are the owners, after all. Dividends, though, are where the shareholders get their money back free and clear. There’s no ambiguity about how the money is “getting reinvested in the company” and bigger returns are soon to follow.
This post, and the others in the Common Stocks and Uncommon Profits category are inspired by Philip Fisher’s book of the same name. Mr. Fisher wasn’t a big fan of dividends. As a growth investor, I suppose he thought that dividend payments should be invested back in the business.
This is where Mr. Fisher and myself diverge. Admittedly, Mr. Fisher has a much better reputation than I do in the arena of investing. So, take what I say with a grain of salt.
But, I like the idea of a “guaranteed” return. Not completely at the expense of capital gains, of course. But, even if you don’t need the income, I think that taking some profits “off the table” is a hedge for risk.
Sure, if a company can reinvest that money and truly earn a better return, then that’s what they should do. I simply think that there are way more companies than there are compelling projects for these companies to invest in.
In any event, higher dividend yields are typically better. Keeping in mind some of the characteristics of quality yields.
| Annual Dividend | Stock Price | Dividend Yield | |
|---|---|---|---|
| International Business Machines Corporation (IBM) | $6.50 | $127.14 | 5.1% |
| Accenture plc (ACN) | $3.20 | $229.01 | 1.4% |
| Cognizant Technology Solutions Corporation (CTSH) | $0.86 | $66.41 | 1.3% |
Payout ratio
Payout ratio = total dividends paid (dividend per share × basic average shares) ÷ net profit
Dividends are paid out of net profit. How much net profit to pay to shareholders can vary wildly from company to company.
The dividend payout ratio is worth calculating so that you know how much profit the company is returning to shareholders. Conversely, how much is it keeping to reinvest in the company? Then, you can decide if you feel as though the company is acting wisely in this regard.
The dividend payout ratio is represented as a percentage. Higher could be considered better – to a point. You don’t want the company putting itself in jeopardy long-term in order to provide inflated returns short-term.
In the table below, you’ll see how I calculated the dividend payout ratio for the listed companies.
This differs from the figure I found on other sites (nasdaq.com, marketbeat.com). Only one site, gurufocus.com consistently matched the figures I calculated.
It could be that the other sites used a denominator other than net profit or a different figure for shares outstanding? In any event, this ratio is a bit of a chore to calculate, so if you find a site that you trust, you might just look this ratio up instead.
| Dividends | Basic Avg Shares Outstanding | Total Divs Paid | Net Profit | Div Payout Ratio | |
|---|---|---|---|---|---|
| United Parcel Service, Inc. (UPS) | $1.01 | 866.0 | $875 | $1,768 | 49.5% |
| $1.01 | 864.0 | $873 | $965 | 90.4% | |
| $0.96 | 863.0 | $828 | -$106 | -781.6% | |
| $0.96 | 864.0 | $829 | $1,750 | 47.4% | |
| $3,405 | $4,377 | 77.8% | |||
| FedEx Corporation (FDX) | $0.65 | 261.0 | $170 | -$333 | -50.9% |
| $0.65 | 261.0 | $170 | $314 | 54.0% | |
| $0.65 | 261.0 | $170 | $559 | 30.3% | |
| $0.65 | 260.9 | $170 | $744 | 22.8% | |
| $679 | $1,284 | 52.8% | |||
| J.B. Hunt Transport Services, Inc. (JBHT) | $0.27 | 105.5 | $28 | $121.7 | 23.4% |
| $0.27 | 105.5 | $28 | $104.8 | 27.2% | |
| $0.27 | 106.2 | $29 | $144.7 | 19.8% | |
| $0.26 | 106.6 | $28 | $118.4 | 23.4% | |
| $113 | $489.6 | 23.2% |