Compounding is the 8th Wonder of the world.
Compounding is the most powerful force in nature.
You have heard all the catchy sayings in regards to compounding. They’re overused, but they’re right. Compounding is very powerful. Until you’re able to see compounding in action, though, its power won’t be completely evident to you.
Well, you could spend an entire lifetime investing and hopefully see how compounding can help you build wealth with stocks and other Investments. Or, you can create a model in a spreadsheet.
In a spreadsheet, you can toy with all the variables. Create best-case and worst-case scenarios. Live a thousand lifetimes over the course of a few minutes.
This post will cover how to build your own compound interest spreadsheet. If you’d like to read more on this subject (and watch a video) click on this post here.
Download the compound interest spreadsheet
If you’d rather use a functioning compound interest spreadsheet right now, rather than spending the next couple of hours building one – complete the form below and click Submit.
A link to the Google Sheet will be emailed to you.
Once you’re in the spreadsheet, click on File > Make a copy to edit. I’ll no longer be responding to “Requests for access.”
How to create a compound interest spreadsheet in Google Sheets (Excel)
The workbook will look at compound interest from several different angles. Each spreadsheet operates independently. So, if you’re only interested in one of the spreadsheets, you can follow along and build that one while ignoring the others.
In the past, for my “how to create a ___ spreadsheet” posts, I have walked through, in detail, about what formulas to enter where. With this post, I’m going to try something a little different. I’m simply going to provide pictures of every single formula entered into the worksheet. That should eliminate some confusion and also be a little more efficient for me.
Format this spreadsheet however you like. However, you might notice some things I do consistently. Most notably, I fill cells (with color) that have formulas in them, or otherwise shouldn’t be edited. Leaving the editable cells white, I think, makes it easier for others to understand and use the spreadsheet. I also like to leave row 1 and column A blank. It’s my opinion that the additional whitespace makes for a better-looking spreadsheet.
What is compounding?
This worksheet models how stocks and other investments compound over time. Beyond that, it illustrates how interest can snowball.
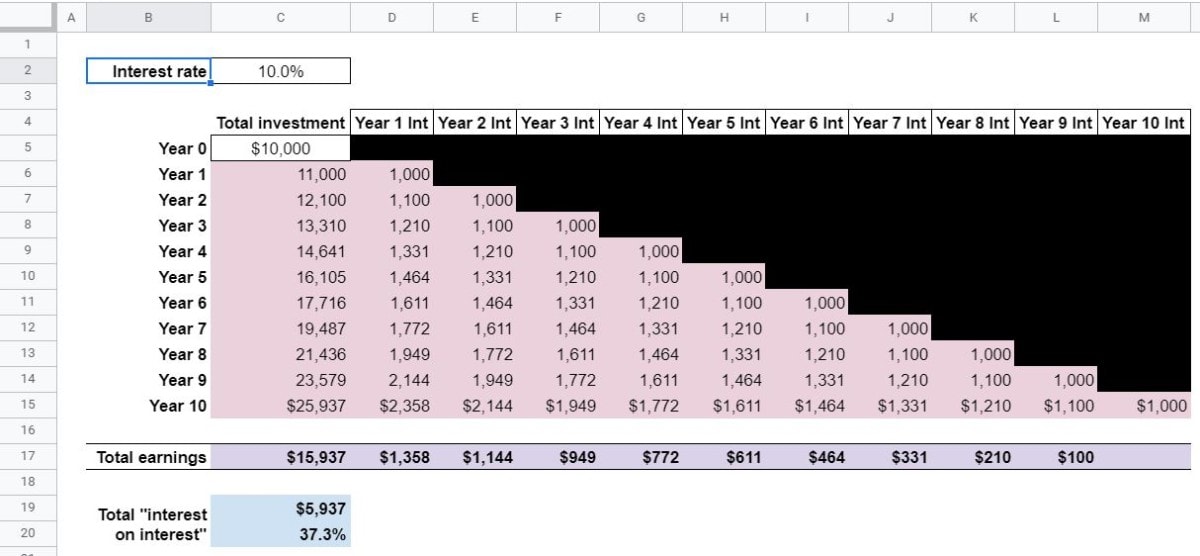
This is what the finished product should (roughly) look like:
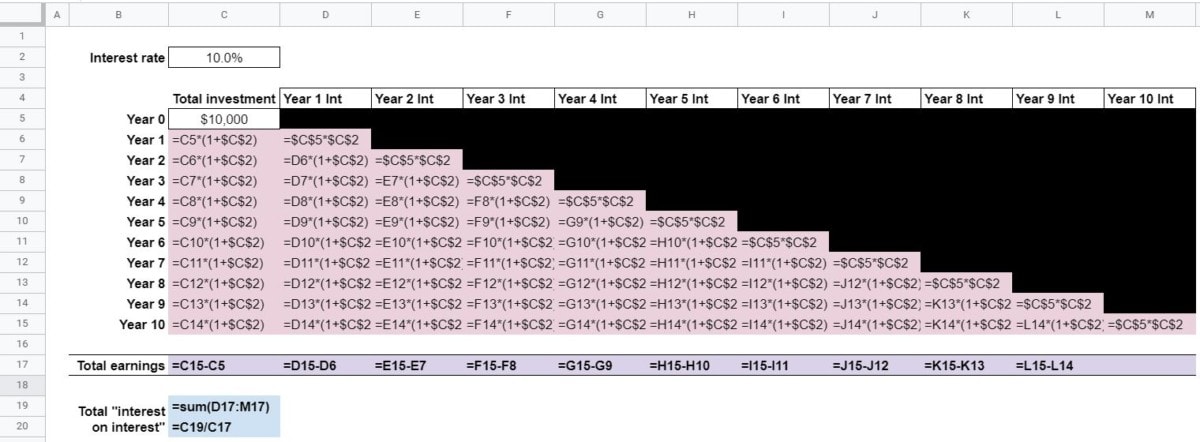
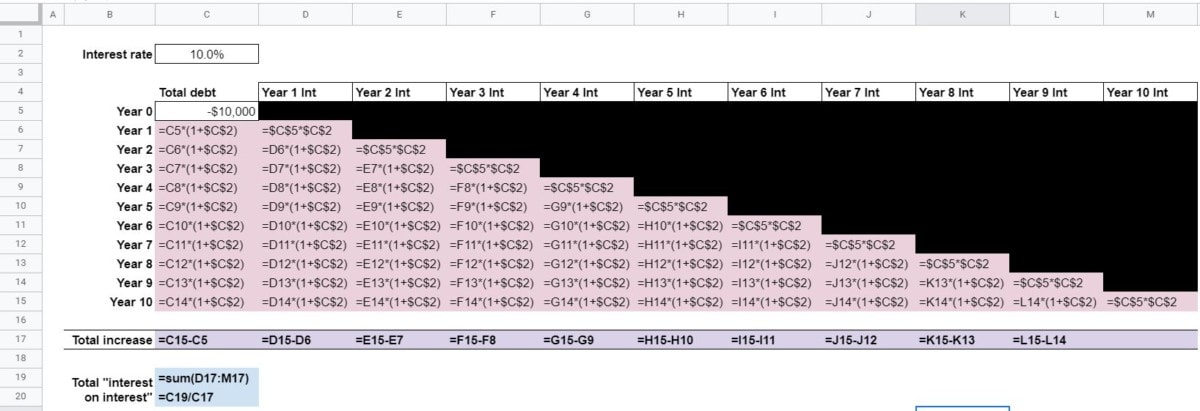
And, here’s what it looks like with all of the formulas showing. I’ll provide pics of each individual section below.
The user of this worksheet will only enter an interest rate and a beginning (Year 0) Total Investment amount.
Based on those two variables, the compounding growth of the Total Investment will be calculated. Beyond that, the interest earned on interest will also be calculated for every year.
Then, it can be shown (dollars and percentage) how much of the investment’s total interest earned is interest on interest.
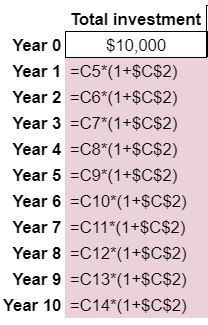
Here’s a look at the formulas in the Total Investment column. Note that absolute references ($, dollar signs) are used to make copying and pasting easier.
These are the formulas for Year 1 Int – Year 5 Int:
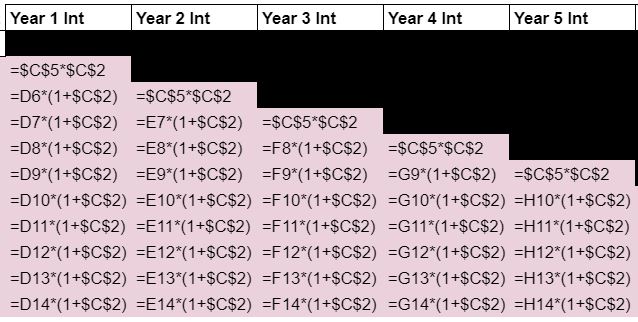
There are a couple of things to note here. First of all, the top formula in each column is the same. This is the interest earned on the initial investment, NOT interest on interest.
The second thing to note is that the formula is the “stair-stepping” down. This is because, of course, Year 1 Int isn’t earned until Year 1, Year 2 Int isn’t earned until Year 2, and so on… You’ll never earn Year 3 Int in Year 1. Hopefully, that makes sense.
Every formula below the top one (in the Year # Int columns) follows the same pattern. It measures the earnings (interest on interest) for that Year’s Int received.
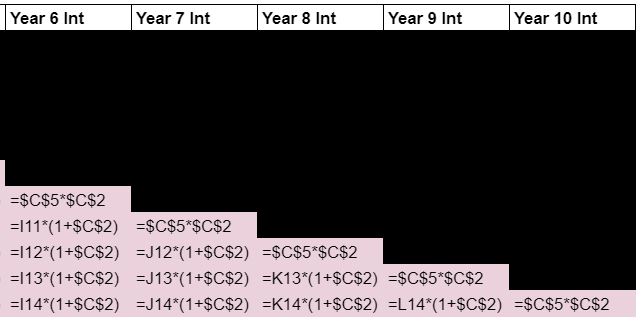
Year 6 Int through Year 10 Int follow the same pattern:
The Total earnings formulas are pretty straightforward. Here, we’re taking the Year 10 value and subtracting the beginning value for each column. Therefore, there is no need for a formula in the Year 10 Int column. Here’s what those formulas look like:

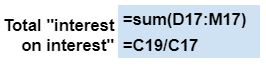
Finally, we have the Total “Interest on interest” formulas (dollar and percentage). The dollar formula simply sums the Total earnings for each Year’s Int. The percentage formula simply divides that amount by the Total earnings for the Total investment.
Understanding compounding
This worksheet is essentially the same as the What is compounding? worksheet. It was created to look at interest from the perspective of debt rather than investment, however.
So, all of the formulas are the same as those you previously entered.. Total debt is the column heading instead of Total investment. A negative amount (-$10,000) is also entered as the Year 0 amount rather than a positive one.
If you do wish to make an Understanding compounding worksheet, all you need to do is copy the What is compounding sheet (Right-click > Duplicate).
Compounding formula
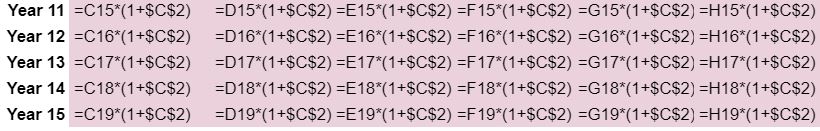
Good news! This worksheet is also a lot like the What is compounding? worksheet. It’s the same principle, just over a longer timeline.
So, to save time, you should duplicate the What is compounding? worksheet (as outlined above). Or, you can just build on top of it by inserting rows below Year 10 (highlight rows > right-click > Insert # below/above). If you do that, you’ll also want to add Year 11 Int – Year 15 Int out to the right of Year 10 Int.
The top formula for each Year # Int column will correspond with the appropriate Year on the far left column. That formula represents the interest earned on the initial (Year 0 Total investment).
Every formula under that will calculate the growth of that interest payment (“interest on interest”).
The Total earnings row will calculate the difference between the Year 15 (or whenever you want to end your analysis) value and the beginning value in that column.
The Total “interest on interest” formulas will stay the same. They’ll just refer to a new row.
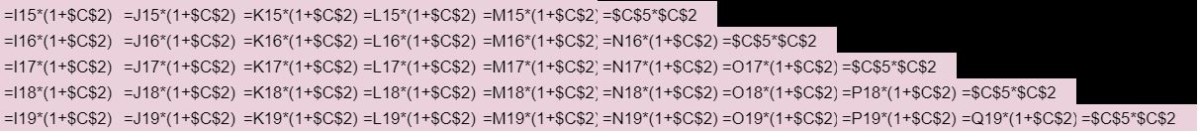
Here’s a look at what those additional formulas will look like:
Compounding periods
The three previous spreadsheets were all very similar. Here, you’ll have the opportunity to examine compounding from a different perspective.
Specifically, you’ll calculate the effect of more/less compounding periods on the total amount of interest earned.
Yes, if you didn’t know, more frequent compounding means more earnings. Even for the same stated interest rate. As you’re doing your investment research – if you see the term “APY” (annual percentage yield) referenced, then the frequency of compounding has been factored in. If you simply see a stated interest rate, then it might not have been.
In this spreadsheet, we’ll look at three different compounding frequencies – yearly, quarterly, and monthly. Furthermore, we’ll calculate the additional benefit from more frequent compounding in dollar and percentage terms.
The formulas are shown below. Pay particular attention to the number that the Annual interest rate is divided by at the end of the formulas for Quarterly and Monthly compounding (“/4”, and “/12”).
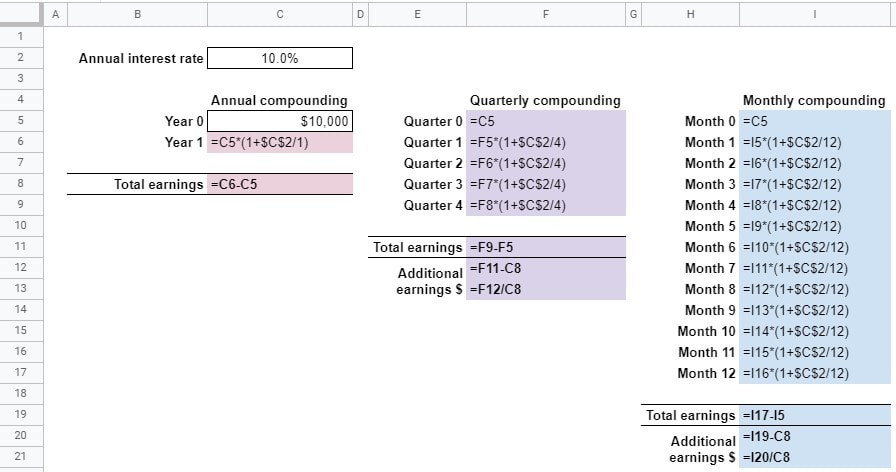
For each compounding scenario, the Annual interest rate is divided by the number of compounding periods. The previous balance is then increased by that amount.
Total earnings simply compares the beginning and ending balances.
Additional earnings compares Total earnings (for Quarterly and Monthly compounding) to Annual compounding. The dollar and percentage differences are calculated.
Capital gains
Here is another unique way to examine the effects of compounding on stocks and other investments.
Not every investment earns a uniform interest rate every year (e.g. 10%, as shown in the previous examples). Frequently, as with stocks, the return from capital gains can vary wildly from year to year.
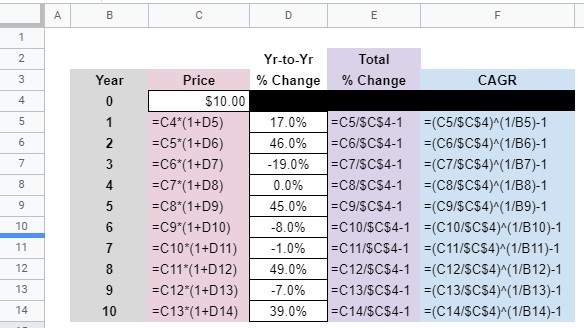
This spreadsheet will illustrate how a single number can summarize the cumulative effect of gains and losses over several years. That single number can be the Total % Change or the CAGR (compound annual growth rate).
The Total % Change compares the current price of the investment to the Year 0 price.
CAGR translates that Total % Change into an annualized percentage gain/loss which makes it easier for comparison to other investments.
For the user of this spreadsheet, all that needs to be entered is an initial Price for the investment and a Yr-to-Yr % Change. Everything else is calculated.
Here are the formulas that need to be entered for you to make your own Capital gains spreadsheet:
Dividends
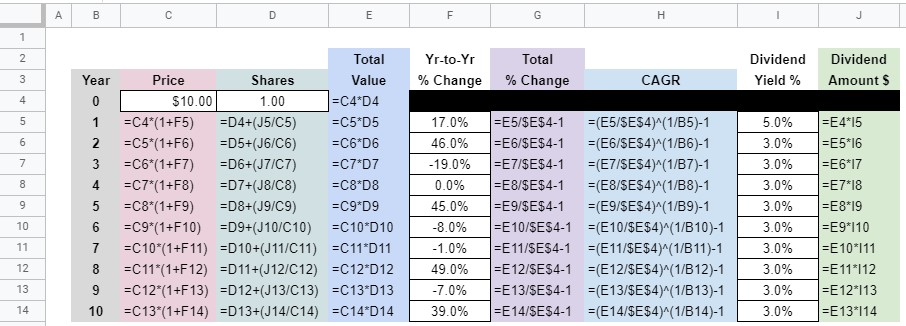
This spreadsheet expounds on what was built in the Capital Gains worksheet. Except, here, the compounding effect of dividends is explored. Dividends can only compound if they’re reinvested (DRIP).
To thoroughly explore the effect of compounding dividends, a few more columns had to be added.
For starters we need to know how many Shares we’ve accumulated through dividend reinvestments.
The Total Value is Price × Shares. This is what we’ll now use to measure our Total % Change.
Then, of course, in order to know the effect that dividends have, we’ll have to know the Dividend Yield % and the subsequent Dividend Amount $.
In addition to Year 0 Price and Yr-to-Yr % Change, we’re going to make Year 0 Shares and Dividend Yield % variables that the user of this spreadsheet can change.
Here’s a look at all of the formulas in this worksheet if you’d like to create your own:
Rule of 72
Finally, we’ll take a look at compound interest investing from one more angle.
If you’re not familiar, the Rule of 72 is a rule-of-thumb for estimating how long it will take for an investment to double. All you do is divide 72 by the (expected) return/interest rate. For example, a 7.2% interest rate, allowed to compound, would be expected to double our investment in 10 years (72 ÷ 7.2 = 10).
The Rule of 70 is an alternative rule-of-thumb used to make the same estimation.
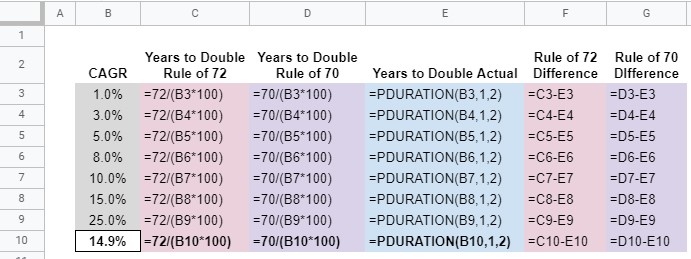
In this spreadsheet, I compare the Rule of 72 and Rule of 70 to the actual number of years it would take for an investment to double in value. Furthermore, the user can input their own CAGR to see how long each rule-of-thumb estimates it would take for their investment to double. Plus, of course, the spreadsheet will calculate the actual number of years needed to double their investment.
Here are the formulas for the table. Note the PDURATION formula. This is one you probably don’t see very often. It calculates the number of periods (years in our case) that are needed for investments to reach a certain value. In our case, we want to know how many years it will take for an investment to double (from “1” to “2”) based on a given CAGR.
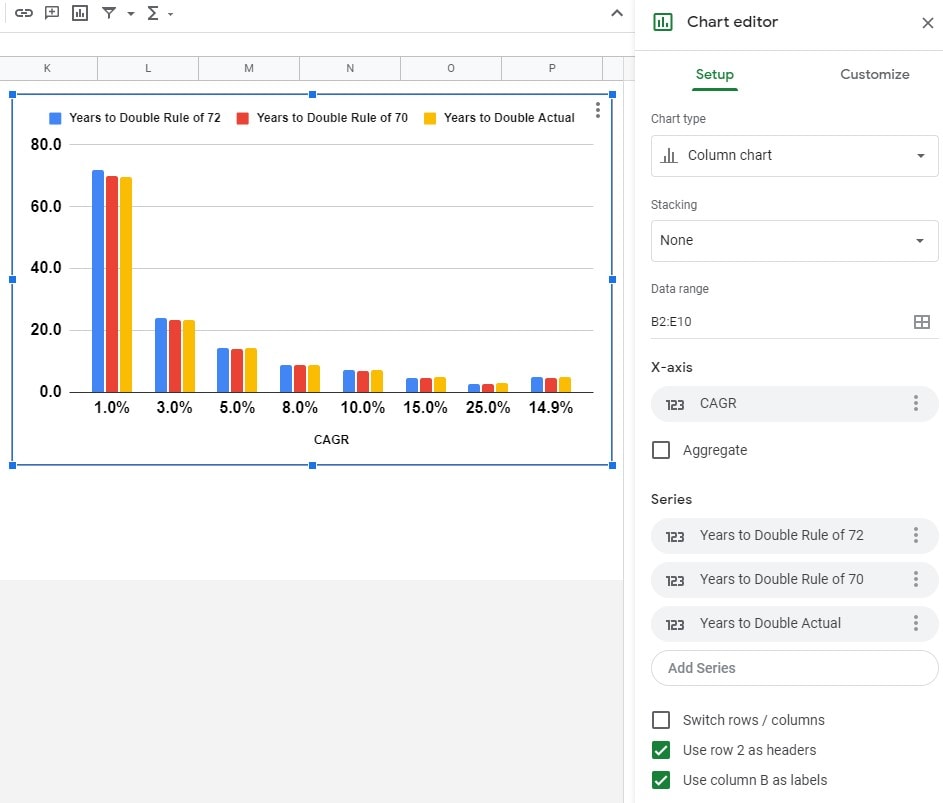
Additionally, I included a chart. That’s done by selecting the appropriate data and clicking on Insert > Chart.
Here’s what the Setup on that chart looks like for my example. Feel free to customize as you see fit.
Compound interest investing spreadsheet and workbook
Hopefully, this how-to (and/or the download) helped you create an investment workbook that illustrates how compounding works in a manner that makes sense to you. Additionally, it is hoped that your greater understanding of compounding will help you make more informed investment decisions in the future.