A sales target analysis compares actual revenue to expected revenue. The expected revenue is the “target.” When performing a sales target analysis as part of your stock research, several different targets can be used.
A sales target analysis provides a couple of key benefits to the investor. First, it allows you to isolate when and why targets were greatly missed. Second, by understanding what drives revenue, you can hopefully create better forecasts when performing your own investment analysis.
Common Stocks & Uncommon Profits, Point 4
This is another post inspired by Philip Fisher’s book Common Stocks and Uncommon Profits.
Point 4 (of 15) asks if the company has an “above average sales organization.” This was explored previously in my post on sales growth analysis. If the plan holds, there will be six posts after this focusing on different sales metrics.
As before, I’ll be using an example company to demonstrate the topic at hand. Facebook, Inc. (FB) will be my example again. Just as they were with the sales growth analysis post.
Download the Evaluation of the Effectiveness of the Sales Organization workbook
This workbook will include all the worksheets used in the Point 4 posts.
Complete the form below and click Submit.
A link to the Google Sheet will be emailed to you.
Once you’re in the spreadsheet, click on File > Make a copy to edit. I’ll no longer be responding to “Requests for access.”
What is a sales target analysis?
A sales target analysis is the examination of actual revenue compared to “sales targets.”
But what are sales targets?
Generically speaking, they are revenue goals for the sales organization. Within a company, these would be dictated by management or executives.
Department heads are usually held responsible for keeping expenses below a budgeted amount. In revenue-generating departments, however, they’re likely also responsible for keeping sales above a certain amount.
This subject of operating budgets is covered in more detail on my other site, SpreadsheetsForBusiness.com.
A sales target analysis is simply an analysis of what the revenue targets are (were) and why they were or were not met.
But, as an investor, how do you know what the sales targets are? You aren’t privy to the same information as those within the company.
Since that’s the case, we’ve got to come up with a proxy for these sales targets.
First and foremost, most companies are going to be given sales targets by other outsiders. So we can use that. Analysts from brokerages are going to follow the company closely – unless it is very obscure. They’ll make their estimates public and we can measure actual revenue against those.
Analyst estimates are the low-hanging fruit, so to speak. But, what else can we use to perform a sales target analysis from a different perspective?
Alternatives to analyst estimates
SpreadsheetsForBusiness to the rescue again!
Using the principles of forecasting covered there, we can make our own retroactive forecasts. Then, we can compare actual revenue to “expected” revenue.
The link above goes into more detail about the two forecasting methods. But, here’s a summary:
Extrapolation forecasting
Here, Total revenue is dissected by seasonality, trend, and cyclicality. What’s left is considered Noise. Noise is compared to Total revenue ($ difference, % difference).
Explanatory forecasting
Here, you can enter data for factors that you think might influence Total revenue. Based on Total revenue’s Correlation to these factors – a forecast is created.
Specifically, the forecast is based on the Fixed amount and the Variable amount. Detail about these amounts is beyond the scope of this post. Again, click on the SFB link above to learn more.
Depending on which factors you choose from the drop-down menu, Correlation, Percent determination, Fixed amount, and Variable amount will change.
Because of the nature of the formula, the Explanatory forecast won’t be able to populate for every quarter/year.
Why perform a sales target analysis?
A sales target analysis allows you to compare expected Total revenue with actual Total revenue.
In this case, however, you get three versions of expected Total revenue.
Forecasts are rarely spot-on. So, we’re not surprised when there’s a small difference. What we want to focus on is when Total revenue is way different than we expected. The information is in the extremes, as Nassim Taleb says.
It’s in these instances that we get the opportunity to learn what it was that we didn’t understand about the company or its environment. Understanding this will, hopefully, help us to forecast Total revenue better in the future.
The Extrapolation and Explanatory supplementary data might help you better understand what drives Total revenue too.
Extrapolation insight
Seasonality explains how Total revenue ebbs and flows due to the time of year. You’ll see a percentage (usually close to 100%) for four periods. This percentage, based on the sample data, is the effect of Seasonality for that quarter of the year.
Obviously, the annual data won’t experience Seasonality.
Trend demonstrates the aggressiveness of Total revenue increases or decreases. If you charted this data you would see that forms a straight line. This is the trend of deseasonalized Total revenue.
Cyclicality has to do with the business cycle. The expansion and contraction of industries and the economy as a whole. Since this percentage is calculated with limited information, I’d take it with a grain of salt. It is basically the ebbs and flows around the Trend line.
Explanatory insight
Correlation has to do with how much particular factors and Total revenue move in concert. In essence, if Total revenue moves up (down), does the factor move up (down)? Does it move with the same magnitude?
Percent determination is Correlation squared. It is supposed to tell you how much of a change in Total revenue can be attributed to this particular factor.
Fixed amount and Variable amount harken back to the concept of Trend. What these statistics imply is that the Fixed amount is what Total revenue would be if the factor was = 0. The Variable amount is the change in Total revenue for a factor change = 1.
Keep in mind the old cliche, “correlation doesn’t mean causation.” You could input any factor – inches of rain in your hometown, for instance. The formulas would produce a result. So, while these calculations can help to provide context, use your common sense when analyzing them.
How to analyze sales targets
Like the Sales Growth Analysis worksheet, there isn’t too much information to enter. The information can be somewhat of a chore to gather, though.
For the Consensus analyst estimate, you’re going to have to search. More specifically, you’re going to search in the past.
Here’s how I would suggest you do that:
First, look at the Filing Date (on the sec.gov website) for the 10-K/Q from the relevant quarter/year.

Credit: sec.gov
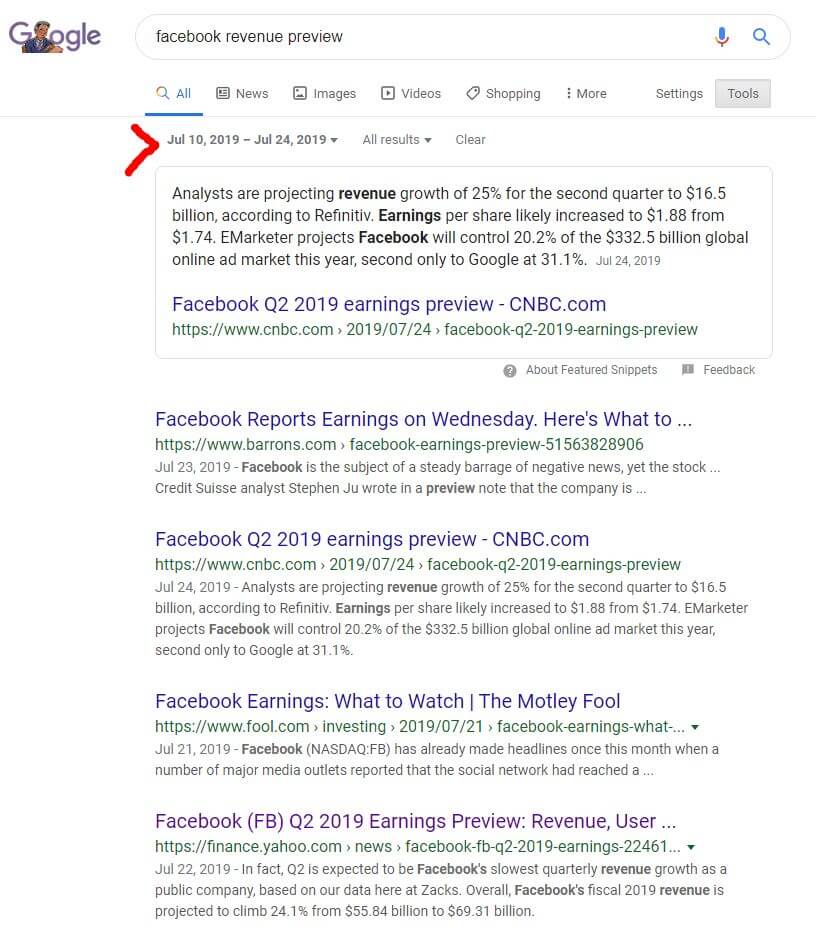
Then, go to your favorite search engine and search for something like “[company] revenue preview.” But, make sure you search during the days leading up to that Filing Date. Two weeks or so should do it.
So, if the Filing Date for the quarter in question is 7/25/19, then I want to search between 7/10/19 and 7/24/19. You might have to tweak these days, but it’s a good start.
We’re looking for articles that will tell us what expected Total revenue was right before the company reported financial results.
That’s it. Try to find an article with this information and populate the Sales Target Analysis worksheet with the information. Use the Consensus analyst estimate field.
Total revenue will automatically populate from the Sales Growth Analysis worksheet.
Extrapolation and explanatory estimates
The sales targets (“Noiseless” revenue) in the Extrapolation section will populate automatically. As will the supplementary data.
In the Explanatory section, you’ll have to populate the information for the factors.
After deciding what factors you want to use, enter the name and the data for the appropriate time periods. The Explanatory revenue estimate and supplementary statistics will populate based on what you enter.
Again, any factors you want can be used here. Just remember to scrutinize the results appropriately.
Wrapping up the sales target analysis
With all of the relevant information entered, you can size up the results. What conclusions you come to will depend on the company you’re analyzing and maybe the factors used in the Explanatory section
Search for news in the weeks following the unusual results. What was the reasoning? Is it indicative of something greater?
You might not get any answers. But, you should come out of the analysis with a better ability to forecast your company’s future revenue.
Sales target analysis for Facebook
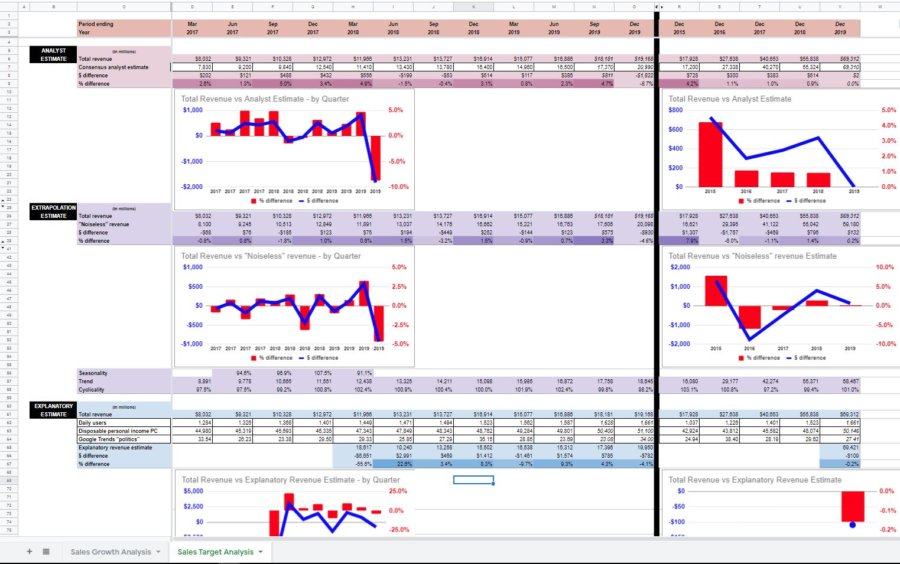
My first impression of the analyst estimates for Facebook is that they are consistently lower than Total revenue. Might be some ulterior motive there. Something related to their employer’s rating for the company (buy, strong buy, etc).
Or they might just err on the conservative side – which I can appreciate.
In any event, as far as Facebook goes, I can assume that their Total revenue every quarter/year will come in above the Consensus analyst estimate.
Q3 2017 was Facebook’s biggest positive surprise for Total revenue. Followed closely by Q1 2018. Let’s see if we can figure out why…
To do so, I’ll search for “Facebook revenue” in the weeks following the SEC Filing Date.
Q3 2017 was the first time Facebook’s revenue was above $10 billion. It could have been that as they approached that milestone, there was an extraordinary push to top that number.
Nothing else in the articles I read really stuck out to me as remarkable for Q3 2017.
Same for Q1 2018. Some mentions of Instagram and mobile ad revenues for both quarters, but nothing particularly unique.
Fiscal year 2015 also delivered more Total revenue than expected. It’s my impression that this was due to the culmination of several efforts. Efforts that made Facebook generally, and advertising specifically, more mobile-friendly.
Facebook total revenue extrapolation
If we look at the deseasonalized Trend for Facebook Total revenue, we see that it was at $10.665 billion for Q3 2017. $12.438 billion for Q1 2018. So, in each instance, it would seem that the analysts ignored the trend or overestimated the effects of seasonality/cyclicality.
Noise is the variation in Total revenue that is otherwise unaccounted for. That didn’t seem to contribute to the $ difference either. Across the board, the randomness of noise seems to be minimal.
Looking at fiscal year 2015 through the lens of Extrapolation tells us that there was a lot of noise to the upside this year. So, maybe it’s not mobile advertising that made for greater-than-expected Total revenue? Maybe it was just randomness? You’ll notice that the next year, the pendulum swung the other way – pulling Total revenue down.
Facebook total revenue explanation
Admittedly, I didn’t put too much thought into the Explanatory factors. Daily users was kind of a gimme and has a strong correlation to back it up. This is one of those instances where we can safely assume that Correlation = causation.
Disposable personal income PC (per capita) was included because I’m doing a lot of work with government statistics on my sister site SpreadsheetsForBusiness.com. I figured that since Facebook is technically entertainment, that there might be a solid Correlation between this factor and Total revenue. I ended up being more correct than I thought. The Percent determination for this factor is 93% (quarterly). Correlation might not be causation here. But it is food for thought.
Google Trends “politics” surprised me in the opposite direction. I thought for sure that the popularity of politics would increase the amount of time people spent on Facebook. And, it might. But it doesn’t seem to translate into an increase in Total revenue. The Correlation/Percent determination is very low at 7.9%/0.6% (quarterly).
It’s the low Correlation of Google Trends “politics” that I assume accounts for the wild differences between the Explanatory revenue estimate and Total revenue. If I were to continue to analyze Facebook on an ongoing basis, I would probably replace this factor with something that has a higher Correlation.
Sales target analysis
What other resources might be used to generate sales targets?
What’s a trap to avoid when looking to the past to forecast the future?
Are there any insights from Facebook’s sales target analysis that I failed to address?