
A dividend income spreadsheet will tell you how much you need to invest in a stock, ETF, or mutual fund in order to meet a monthly cash goal.
Dividends and income go hand in hand. Dividends can be reinvested, sure. But, ultimately their appeal is the income they provide. At least for most people.
Any dividend income is good. But, how much do you need to invest to earn, say, $500 per month in dividend income?
Well, it depends on what you’re invested in.
So, to answer this question, you’ll need a dividend income spreadsheet. You can either download one or make your own.
Download the Calculate Dividend Income Spreadsheet
This is a pretty simple spreadsheet. However, maybe you’d rather let me do the work while you enjoy the benefits?
Fair enough – complete the form below and click Submit.
A link to the Google Sheet will be emailed to you.
Once you’re in the spreadsheet, click on File > Make a copy to edit. I’ll no longer be responding to “Requests for access.”
How do you calculate dividend income in Excel?
If you’ve decided to build your own dividend income spreadsheet, then good for you! You’ll be able to customize it just the way you like it.
As I said, this worksheet is pretty straightforward. In fact, you’ll spend more time looking up the Trailing Twelve Month (TTM) Dividend than building this spreadsheet.
If you copy what I’ve done here completely, you’ll be able to look at the investment needed to earn three different levels of dividend income across a multitude of different investments.
If you want to simplify this further, you can only look at one level of income and one investment (row) at a time. It’s a matter of preference.
My examples below will use Google Sheets rather than Excel. Everything in Excel will be the same except the GOOGLEFINANCE function. That data will have to be entered manually.
Spreadsheet formatting is a matter of preference. Whether you download or make your own, you can, of course, format it however you like. Personally, I like to color the cells with formulas and leave the variables (user input information) white.
Rather than walking you through every single formula in the worksheet in detail, it’s easier to simply show you all of the formulas in an image and let you copy them. I’ll also explain the purpose of most formulas to provide a little context.
With that said, let’s get into it…
$500 a month in dividends
This workbook only has one worksheet. Again…simple.
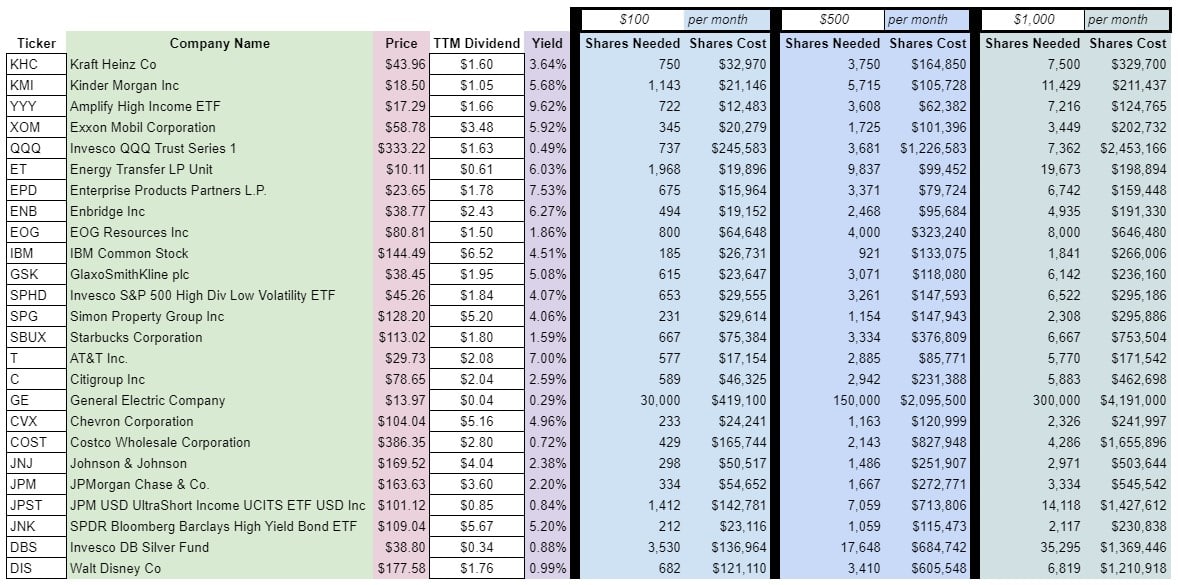
Here’s what the finished product should roughly look like:
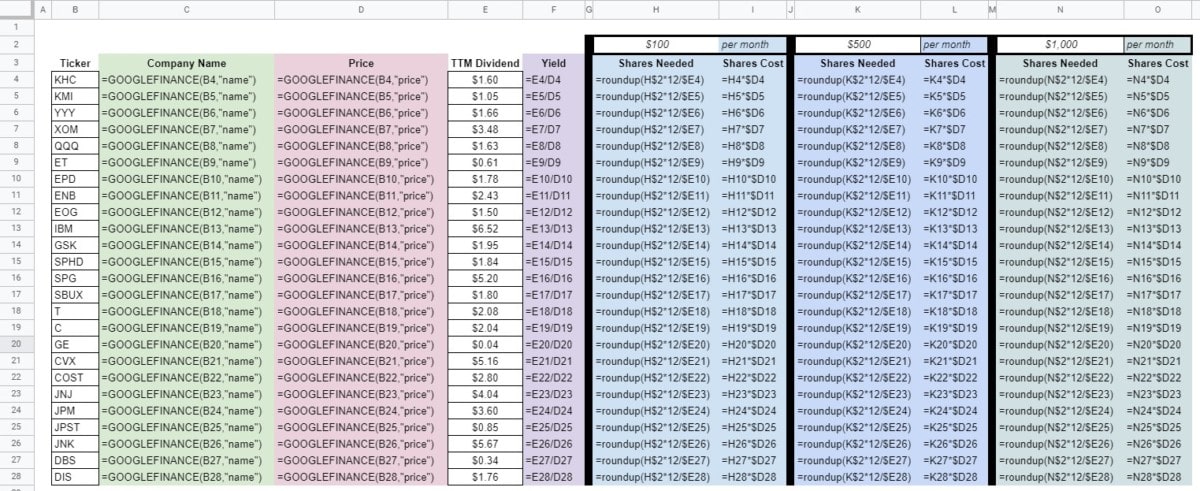
Here’s a look at all of the formulas that comprise the spreadsheet:
Each section will be shown in greater detail, below.
In general, there are only three inputs on this spreadsheet for the user.
The Ticker for the stock that they want to analyze.
The TTM Dividend for a given Ticker. Again, TTM = Trailing Twelve Month, or the amount of dividends paid over the previous 12 months.
Finally, the $ per month that the user wants to earn. All three sections operate the same. I included multiple sections so that different monthly incomes could be compared side by side.
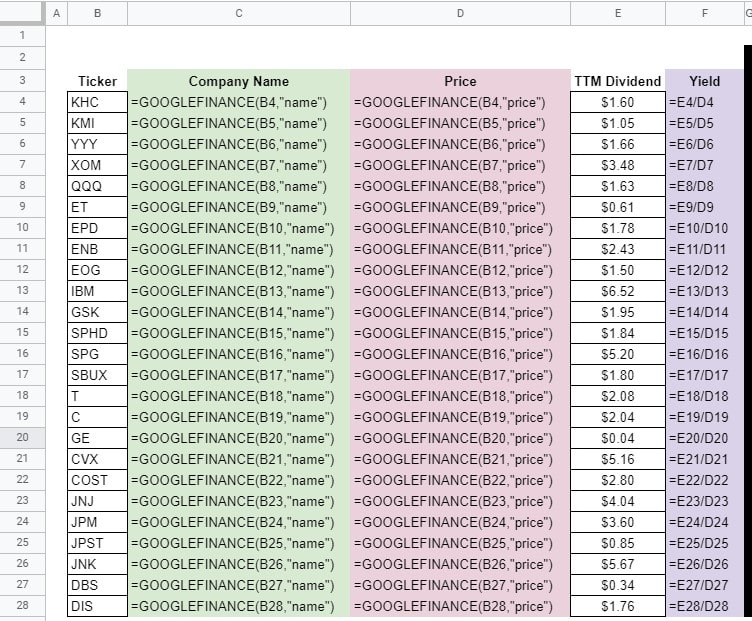
Note the use of the GOOGLEFINANCE function. It is utilized to bring in the Company Name and Price for a given Ticker.
The Yield formula simply compares the TTM Dividend to the Price.
Also worth noting is the HYPERLINK formula I put at the bottom to easily connect the user with the Nasdaq dividend history tool (my favorite to use).

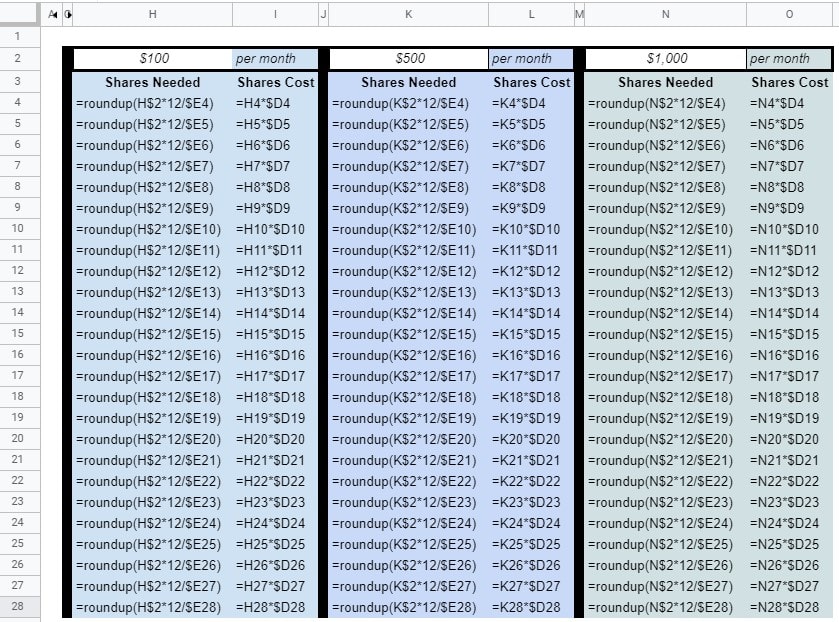
The Shares Needed formula looks at the desired $ per month and multiplies it by 12 to get a yearly amount. That yearly amount is then divided by the TTM Dividend. The number of Shares Needed is rounded up to the nearest whole share.
The Shares Cost formula simply multiplies the Shares Needed by the Price.
Here’s a closer look at those formulas:
Disadvantages of the dividend income spreadsheet
This worksheet is pretty straightforward and objective. The answers it provides might not be what you wanted to hear, however. It can take a big investment to earn a modest amount of monthly income from dividends. Do keep in mind, though, that dividends tend to grow over time. So, your yield today won’t necessarily be your Yield On Cost (YOC) tomorrow.
Also, this worksheet won’t provide any investment guidance, per se. Be wary of investing in a stock just because it (appears to) provide the best “bang for the buck” right now.
This spreadsheet also looks to the future. It doesn’t necessarily take into account any dividend-paying investments you currently hold. I have other worksheets for that.
It also doesn’t consider a portfolio of stocks. It only looks at individual investments. These shortcomings are something I might address in the future. Or, if appropriate, I might make a new spreadsheet.


thank you