Investors make money in stocks through capital gains (change in share price) or dividends. Money can be made quickly or slowly. It can also be lost. Most stocks are purchased through a brokerage (e.g. Charles Schwab, Fidelity Investments, TD Ameritrade). The simplicity of buying/selling and the potential for big returns make stocks an attractive instrument for investors. Investing decisions are primarily made through two types of analysis – fundamental (evaluating financials) or technical (evaluating prices and charts).
People who are interested in making their money grow often start their investing journey with stocks. Stocks are considered by many to be the best investment to start with. Why? Because they offer the opportunity for exceptional returns, can be actively or passively managed, and because there are few barriers to entry.
Stocks for financial security
Financial security is being free from worries related to money. The amount of money needed for financial security differs for every person. Therefore, the amount of time needed to achieve financial security is also different for every person. Stocks provide an opportunity for investors who are willing to learn and adapt to become very secure financially. Financial security contributes to overall wellbeing and can be achieved by understanding your expenses and your tolerance for volatility.
Most people know that fortunes have been made in the stock market (and some lost). Though, they might not be sure exactly how.
There is an almost infinite number of ways to choose stocks. There are, however, only two ways (generally speaking) to make money from stocks – dividends and capital gains. Dividends are a share of the company’s profit paid to the owner of the stock. Capital gains are an increase in the stock price.
Capital gains & dividends
As I said, these are the two ways that an investor can make money from stocks.
Capital gains come from buying a stock at a “low” price and selling it at a “high” price. For example, consider the following stock transactions for Target Corporation (TGT):
| Date | Transaction | Price | Shares | (Cost)/Proceeds |
|---|---|---|---|---|
| 04/03/2020 | Purchase | $93.00 | 100 | ($9,300) |
| 01/11/2021 | Sale | $193.00 | 100 | $19,300 |
If an investor executed these transactions, their capital gain would be $10,000 ($19,300 – $9,300).
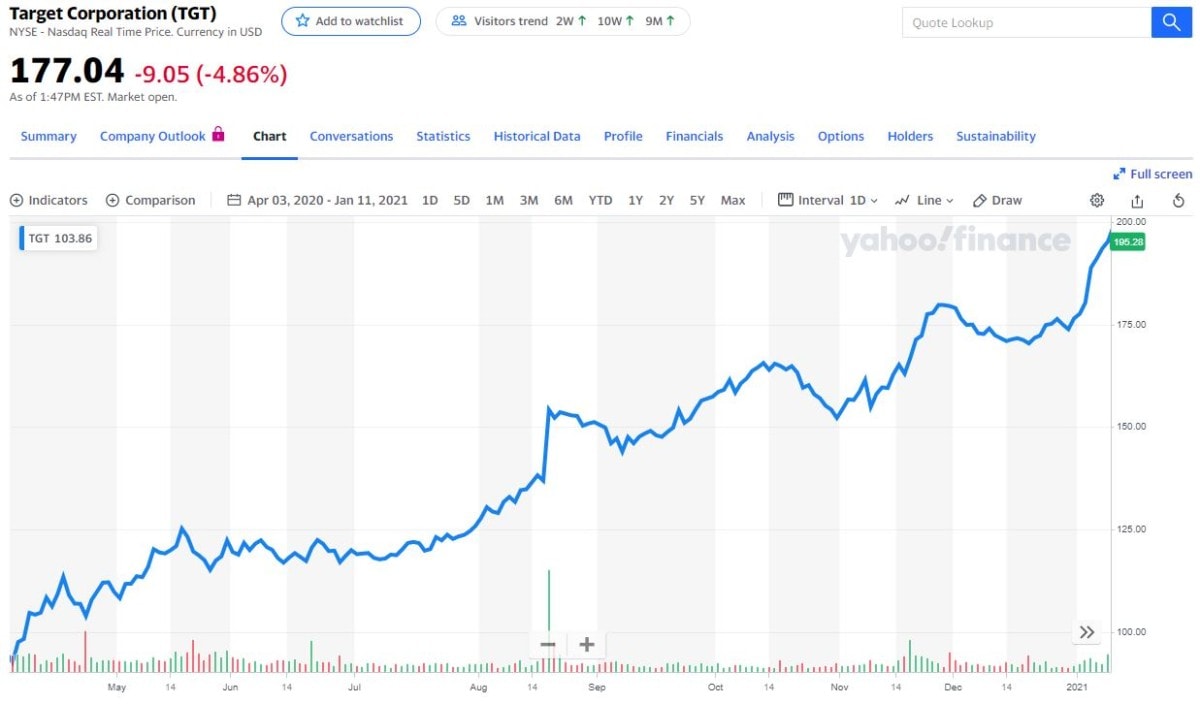
Credit: finance.yahoo.com
Dividends are distributions of profits made by a company. Not every stock pays dividends. Target Corporation (TGT) does pay a dividend and made the following payments in 2020:
| Payment date | Per share amount |
|---|---|
| 03/10/2020 | $.66 |
| 06/10/2020 | $.66 |
| 09/10/2020 | $.68 |
| 12/10/2020 | $.68 |
This is a total of $2.68 in dividends per share. If you had purchased 100 Target Corporation (TGT) shares on 01/01/2020 and sold them on 12/31/2020, you would have received $268 ($2.68 × 100 shares) in dividends.
Investing vs. speculating
What qualifies as investing and what qualifies as speculating is subjective – it’s based on opinion.
The best distinction I’ve ever heard is: “if it doesn’t put off income, it’s speculation.”
Stocks put off income in the form of dividends.
Here are some ways that others have distinguished investing and speculating:
| Characteristic | Investing | Speculating | Source |
|---|---|---|---|
| Risk | Lower | Higher | Source |
| Profit potential | Lower | Higher | “ |
| Research involved | Higher | Lower | “ |
| Unknowns | Lower | Higher | “ |
| Predictability | Higher | Lower | “ |
| Dependence on business performance | Higher | Lower | “ |
| Time horizon | Longer | Shorter | Source |
Again, these characteristics for investing and speculating are not carved in stone. There is a lot of gray area between the two.
Analyzing stocks
There are two general means of analyzing potential investments (or speculations…) – fundamental analysis and technical analysis.
Fundamental analysis
Fundamental analysis is (unsurprisingly) the analysis of a business’s fundamentals.
What’s that mean?
To me, it means analyzing a company comprehensively and forecasting its earnings a long way into the future. Doing so allows you to come up with a fair share price now.
If the stock is considerably below this fair value – you might buy. If it’s considerable above, you might sell (short?) or avoid.
What affects a company’s earnings a long way into the future? Here are some examples:
- Market size and growth rate
- Business model
- Industry trends
- Growth stage and strategy
- Research and development (R&D) management
- Sales growth, target, and conversion analysis
- Unique selling proposition
- Return on inventory (manufacturing and retail)
- Margin analysis
- Management and employee effectiveness
- Cost analysis
- Financial ratio analysis
- Risk management
Here are some other things to consider:
- Equity vs debt financing
- Communication to shareholders
- Economic and political conditions
All the while being mindful of how the competition performs in those areas.
One advantage of fundamental analysis, I think, is that it forces you to scrutinize a stock from every conceivable angle. Which is time-consuming. But, it decreases the likelihood of making an emotional buy or sell decision.
A disadvantage of fundamental analysis is the time commitment required.
There is no one right way to perform fundamental analysis. It’s an art as much as a science.
Technical analysis
Many traders aren’t concerned with a company’s business fundamentals. Rather, their hope is that historical changes in trading activity will allow them to predict future changes in price.
You might say that technical analysis attempts to quantify the psychology of a stock and/or the market as a whole. It does so by examining supply and demand.
Technical analysts place a large emphasis on trends. For example, many will only enter buy orders if a stock is trending up. Or, sell orders for a stock that is trending down.
Another tenet of technical analysis is that history repeats itself.
The number of technical analysis indicators is actually quite astounding considering the limited number of inputs available (Open, High, Low, Close, Volume, Open Interest sometimes…). Yahoo! Finance, for instance, has over 100 technical indicators that you can chart!
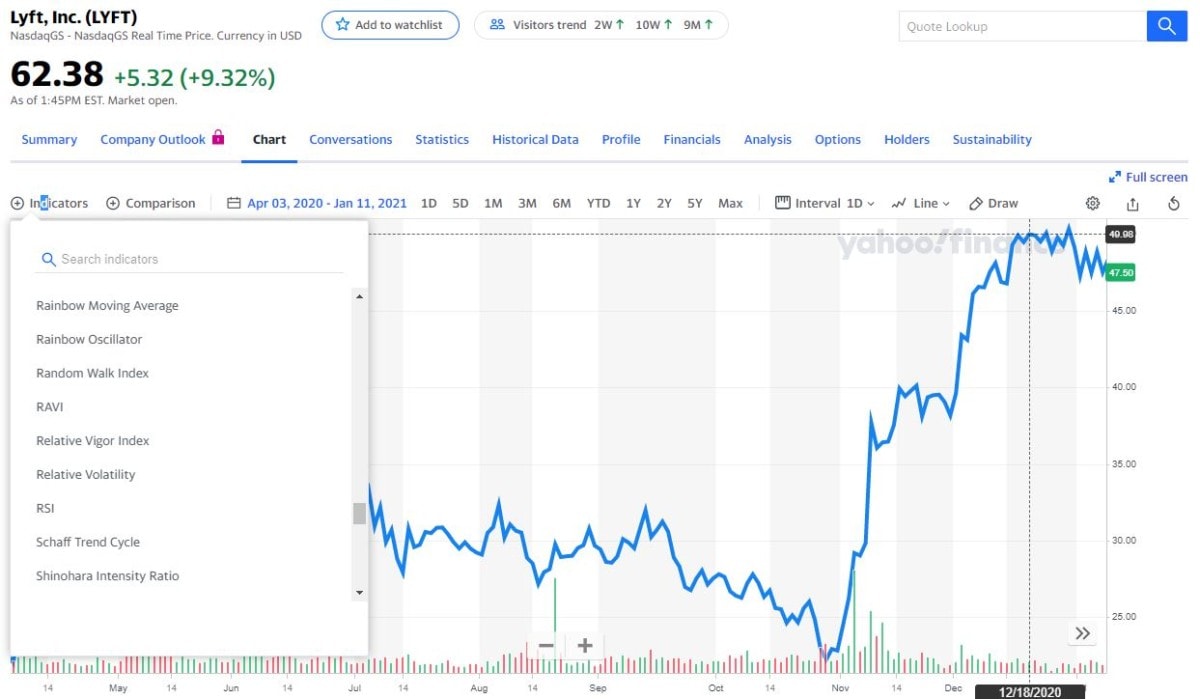
Credit: finance.yahoo.com
So, which of these technical indicators should you use? That’s up to you. But, here are some of the most popular ones:
- Moving Average (MA)
- Exponential Moving Average (EMA)
- Moving Average Convergence Divergence (MACD)
- Relative Strength Index (RSI)
- On-Balance Volume (OBV)
- Bollinger Bands
- Stochastic Oscillator
Of these, Moving Averages and Bollinger Bands are frequently regarded as the simplest to use.
Technical analysis has many proponents and many detractors. The most common criticism of technical analysis is that history doesn’t repeat itself exactly.
On the flip side, here are some characteristics that could be considered benefits (Source):
- It’s easier to understand because it is visual
- It can be used across different investments
- It can be used across different time frames
- Strategies can be (fairly easily) backtested
I’d say that technical analysis is simple to learn and very, very difficult to master.
Know when you’ll double your money with the “Rule of 72”
The “Rule of 72” is a rule-of-thumb that investors use to estimate how long it will take for an investment to double in value. Time to double = 72 ÷ rate of return. The greater the rate of return the shorter the time to double. The “Rule of 72” can be used on any investment that grows through compounding. Though the “Rule of 72” is not exact, it can save time for investors that want to easily estimate the time to double (or the rate of return).
Everybody who invests in stocks wants to make as much money as possible as quickly as possible – regardless of what they say. How much risk they want to take is a different story.
Yes, you can double (or more) your money in 5 years (or less) by investing in stocks. In order to do so, you’re going to need well-performing stocks and you’re going to need to utilize the power of compounding.
Compounding, simply put, is when your capital gains or dividends earn additional capital gains or dividends. It’s the snowballing effect of growth that has been the driving force behind countless fortunes.
How do you find an investment that pays 14.87%?
Why 14.87%?
Because that’s the compounded annual return you’re going to need to double your money in five years.
So, is that attainable? In theory, certainly. I can confidently say there is an abundance of stocks that I could point to, 5 years from now, that returned ≥ 14.87%. Finding those stocks, in practice, might be harder than you think.
So, what does the stock market return overall? Well, it depends who you ask.
It’s not that they’re wrong. It’s just that it all depends. Depends on what you mean by “return” (reinvesting, dividends, etc.) and what time period you use for your sample.
Also, stocks aren’t the only game in town. There are many other investment vehicles that can provide returns that will double your money (or more) in 5 years. For instance:
- Forex
- Options
- Penny stocks
- Cryptocurrency
- Futures
- REITs
- P2P lending
Keep in mind that risk and return are generally linked. When one goes up, so does the other.
Also, keep in mind that returns on stocks aren’t fixed. There is no stock that has a consistent 14.87% return. Rather, it might have a 5.3% return one year and a 25.3% return the next. The cumulative effect is an annual growth rate of 14.87%.
Social or copy trading
In order to obtain returns that beat the market average, you can rely on someone else’s expertise.
Social trading is where you lean heavily on other’s opinions regarding trading. It’s kind of a combination between social networks and trading. Copy trading is a similar concept. However, with copy trading, you’re imitating another trader. Often automatically.
With social/copy trading, you can imitate someone else’s trading activity indefinitely. Or, if you are ambitious, you can learn from the person you’re imitating to shorten your own learning curve.
Here are some social trading platforms to check out. Not all will allow stock trading. Many only allow Forex trading. Source with links to platforms.
- eToro
- ZuluTrade
- SwipeStox/Naga Trader
- Trading Motion
- iSystems
- FX Junction
- Collective2
- Tradency
- Peeptrade
- MQL5
What stocks will double in 5 years?
That’s hard to say. If I could predict such a thing, I wouldn’t be writing this post.
What I can do, though, is give you some examples of stocks that have doubled (or much more) over the previous 5 years. Here are some of those:
- Domino’s Pizza, Inc. (DPZ)
- Insulet Corporation (PODD)
- Netflix, Inc. (NFLX)
- LendingTree, Inc. (TREE)
- DexCom, Inc. (DXCM)
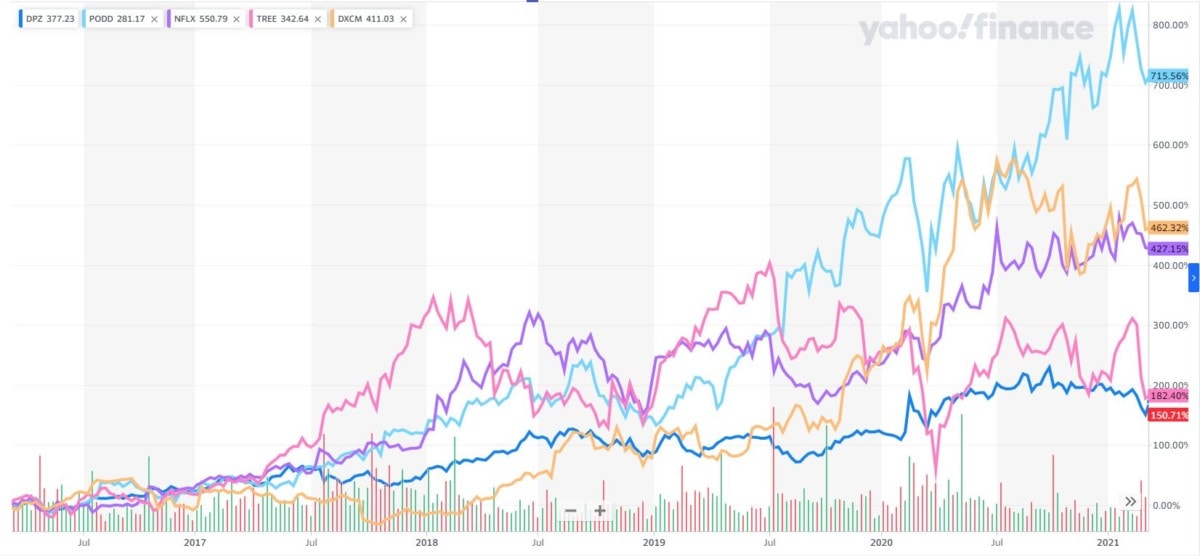
Credit: finance.yahoo.com
Obviously, this list isn’t exhaustive. There are many many more stocks that have gone up over 100% over the past 5 years.
If you’re curious, the S&P 500 index, as of today, has more or less doubled over the past 5 years. It is up 95.4%, and that doesn’t include dividends.
In order for stocks to double (or more), they will have to experience compound growth. I wrote a post with a video and spreadsheet that covers compounding in-depth.
What’s this “rule of 72” and what’s it got to do with anything?
The “Rule of 72” is a rule-of-thumb to approximate how long it will take for your investment to double.
All you need to do is know (or estimate) what your Compounded Annual Growth Rate (CAGR) will be. Then you take that percentage and divide it into 72. For instance, if you assumed you’ll earn a CAGR of 7.2%, then your money would double in 10 years, approximately (72 ÷ 7.2).
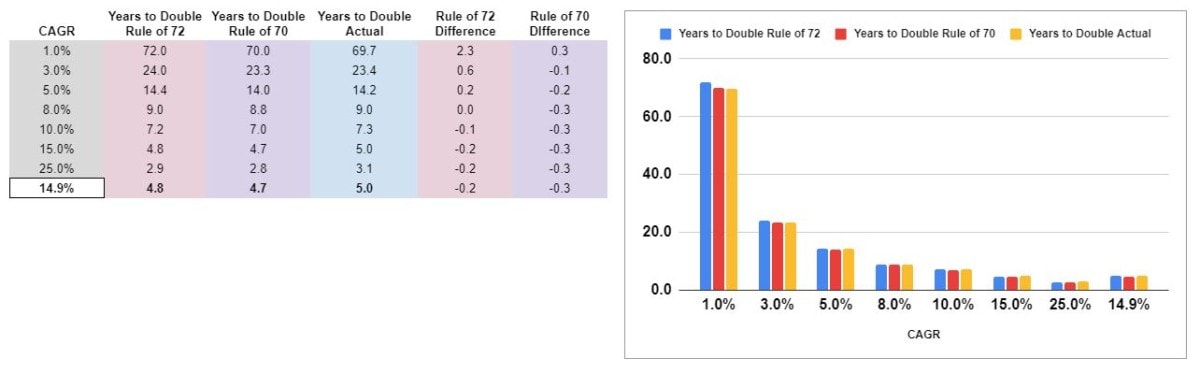
Here’s a comparison of the Rule of 72 to it’s lesser-known counterpart the Rule of 70. Also, a calculation of exactly how long it would take for your investment to double.
| CAGR | Yrs to Dbl: Rule 72 | Yrs to Dbl: Rule 70 | Yrs to Dbl: Actual | Rule 72 Diff | Rule 70 Diff |
|---|---|---|---|---|---|
| 1.0% | 72.0 | 70.0 | 69.7 | 2.3 | 0.3 |
| 3.0% | 24.0 | 23.3 | 23.4 | 0.6 | -0.1 |
| 5.0% | 14.4 | 14.0 | 14.2 | 0.2 | -0.2 |
| 8.0% | 9.0 | 8.8 | 9.0 | 0.0 | -0.3 |
| 10.0% | 7.2 | 7.0 | 7.3 | -0.1 | -0.3 |
| 15.0% | 4.8 | 4.7 | 5.0 | -0.2 | -0.3 |
| 25.0% | 2.9 | 2.8 | 3.1 | -0.2 | -0.3 |
| 14.87% | 4.8 | 4.7 | 5.0 | -0.2 | -0.3 |
As you can see, both rules do a respectable job of approximation without having to perform complex calculations. The Rule of 72 is most accurate around a CAGR of 8.0% and the Rule of 70 is most accurate at a lower CAGR.
Also, if you’re a spreadsheet user and want to set something like this up in Excel or Google Sheets, the =PDURATION(rate, present value, future value) formula makes it easy. Just use “1” and “2” as your present value and future value respectively.
Getting “extra” returns
So, with the Rule of 72 we know what it takes to double your money in 5 years. A 14.87% return is doable but well above the typical stock market returns. So, what can you do to boost your returns a little in order to meet that goal?
First, you can take advantage of your company’s 401(k) match – if they offer it. In this post, I compared a 401(k) (with 50% employer match) to an IRA and a Roth IRA. The benefits of the match are clear.
A match from your employer is an instant return – and, usually, a good one. Earning 25%, 50%, or 100% on your money right off the bat saves years of waiting for your contribution to double. At a 100% match, it happens instantaneously!
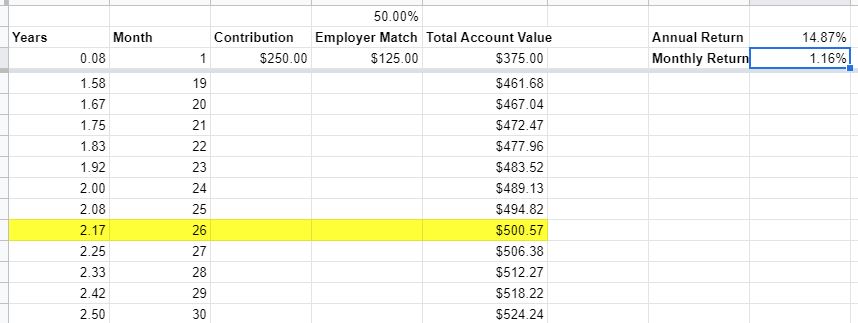
What about a 25% and 50% match?
Here’s a look at a quick and dirty spreadsheet I made to answer that question. It assumes that you make a one-time contribution to your 401(k) and your employer makes a matching contribution.
The annual return is assumed to be 14.87%. The CAGR that would, ordinarily, result in a doubling of your investment in exactly 5 years.
With a 50% employer contribution, your time to doubling drops to 26 months, or 2.17 years. That’s almost 3 years quicker!
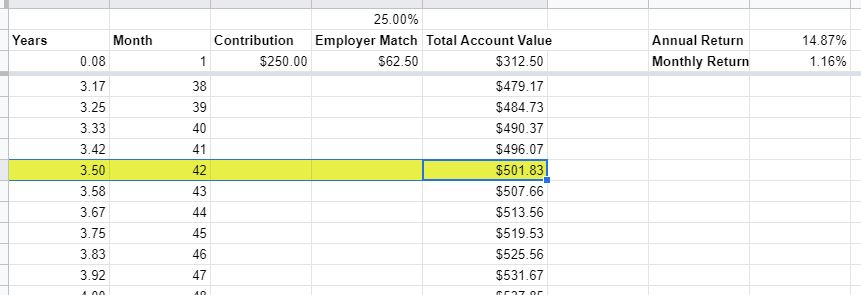
With a 25% employer contribution, your time to doubling still improves. It drops by 18 months to 3.5 years.
Finally, dividend reinvestment isn’t quite as powerful as an employer match. But it can help to shorten the number of years it takes to double your investment.
Dividend reinvestment is typically easy to set up in a 401(k). For investments outside of a 401(k), it depends on the broker, but many are now offering this feature to customers.
Are stocks a foolproof way to get rich?
Stocks seem to strike a balance between being easy (enough) to understand and offering the potential for extraordinary gains. There are, however, other investments that are much simpler. There are also investments that offer much higher returns.
Investing in stocks has disadvantages. Stocks don’t always go up. Whether we’re at the end, or still just the beginning, of an unprecedented economic rise remains to be seen. However, it’s important to understand that risk still exists and any stock investment you make could lose money.
Some investments offer a guaranteed return – however low it may be. Stocks do not have such a guarantee.