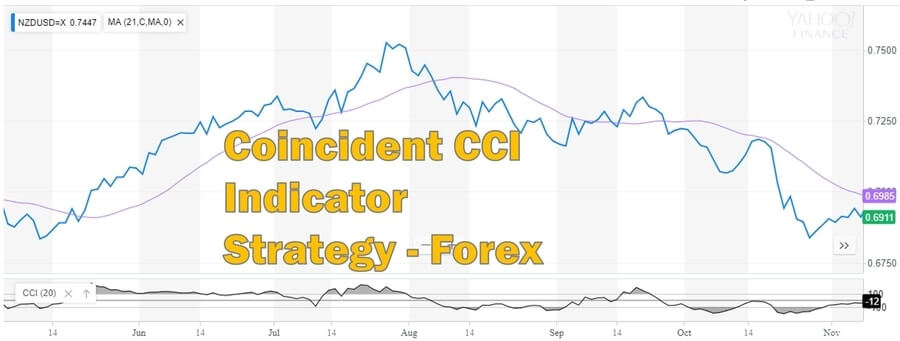
Previously, I examined the effectiveness of a coincident CCI indicator strategy when trading stocks. It didn’t work terribly well. Maybe that particular indicator strategy just isn’t practical for stocks? So, we’ll look at a different type of asset and see if it works any better.
What’s “coincident” mean? It’s a simple way to determine buy and sell signals with the CCI indicator. This stockcharts.com page goes into a little more detail (see the New Trend Emerging section).
A note about my CCI indicator Forex models
Full disclosure: I’ve never traded forex before. “Gasp,” I hear you say. Okay, I understand your concern, but I did do my homework. I educated myself on the nature of margin, lot sizes, and rollover rates – as you’ll see below. I believe the models to be an accurate representation of trading forex. If you have constructive feedback, leave it in the comments. If it’s valid, I’ll update my models and edit this post. Thanks.
Summary of models
- Indexing is the strategy most likely to provide the greatest returns, but it’s only the best about half the time
- Trade with longer-term trends, not against them
- Leverage, predictably, helps take advantage of trades that are consistent with trends
- A short-only strategy should be examined too
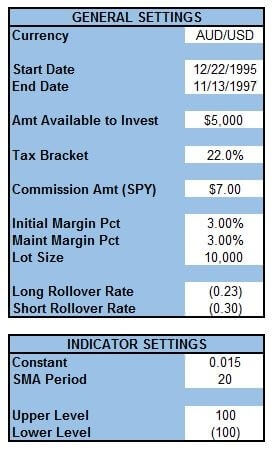
Settings
Every model uses USD as the quote currency.
Just as with stocks, the date range for the model period will be different for each currency. Every model period will be a random length – anywhere from 1 to 10 years.
The amount available to invest will be $5,000. Same as it was for stocks.
The tax rate for short-term gains will be 22%, a middle-of-the-road rate under the 2018 tax reform. Long-term capital gains are taxed at a 15% rate (for the buy & hold and indexing investing strategies).
The commission for trading the index fund, SPY, is set at $7.00. Some brokers will charge more or less, but this what TD Ameritrade is charging at the time of this writing. No commission will be figured into forex trades.
The initial margin percentage will vary, depending on the currency pair. Forex.com is used as a reference. The maintenance margin will be set at the same level as the initial margin, as per the Forex.com margin requirements.
Only 30% of the account value will be used to enter positions. This is done to leave enough in the account to meet margin calls.
The lot size will be 10,000 for each currency pair traded and will remain consistent throughout the model period.
Rollover amounts are also pulled from Forex.com and are current as of the time of writing.
Indicator settings are left at their (unofficial) defaults: the constant is .015, the period is 20, and the upper and lower levels are 100 and -100 respectively.
Whew…that’s a lot of details. Let’s get into the action.
AUD/USD – Australian Dollar / US Dollar
The model period for the AUD/USD currency pair is the same as shown in the example above: 12/22/1995 – 11/13/1997.
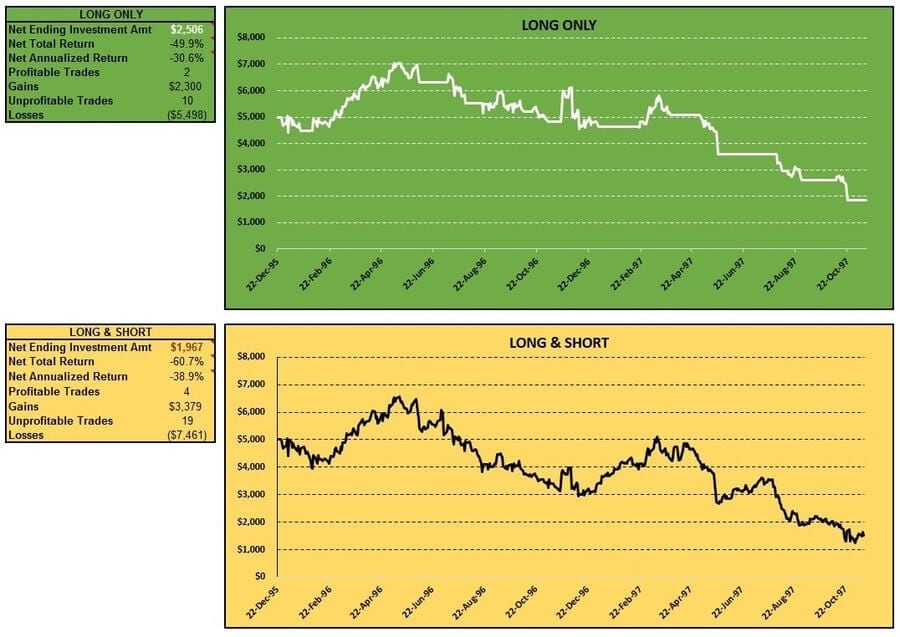
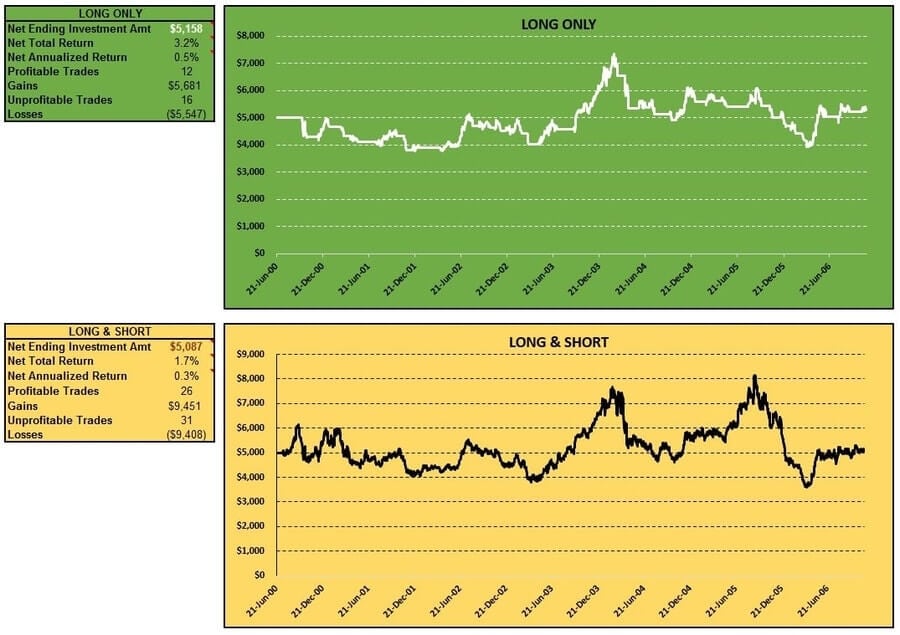
Long-only and long & short trading strategies – AUD/USD
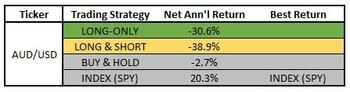
The long-only trading strategy performed poorly. Over the nearly two years of the model period, the net annualized return was an abysmal -30.6%. Things actually started off pretty well. By 5/14/96, the account value reached a high of $7,059! That’s a net annualized return of 140%! Unfortunately, it was all downhill from there. Aside from a few spikes, here and there, the account value trended down for the remainder of the model period.
That’s what happens when your trading strategy is right 2 times and wrong 10. Even if the gains are solid, your account is probably going to get chipped away at. In fact, the long position that took the account value to its high was closed at a profit of $1,842 – the bulk of the gains. Bottom line is, the long-only trading strategy was a good way to lose money. How’d the long & short trading strategy do?
Answer: similarly, but even worse. The long & short trading strategy never saw the account value get as high as it did with long-only. It peaked at $6,552 on the same day as the long-only strategy. Afterward, it trended down too – but with a little more volatility than the long-only strategy due to the increased exposure. When all was said and done the long & short trading strategy delivered a pathetic -38.9% net annualized return.
Profitable to unprofitable trades were the same proportion as the long-only trading strategy. Trades were closed with gains 4 times and with losses 19. Bled to death.
The effect of rollover interest – AUD/USD
A discussion about forex trading strategies (those that are held overnight anyhow) wouldn’t be complete without noting the effect of rollover interest. The long-only trading strategy was dinged for -$428 (-8.6%) and the long & short strategy for -$688 (-13.8%). So, rollover interest wasn’t solely responsible for the degradation of account value, but it did contribute.
It is also important to note that interest rates were probably quite a bit different twenty or so years ago, so the accuracy of these rollover interest numbers is so-so, at best. In a perfect model, we would have daily figures for the long and short rollover rates. Unfortunately, at this time, that data is out of reach; so we work with what we have.
Here’s a look at the long-only and long & short trading strategies charts and tables:
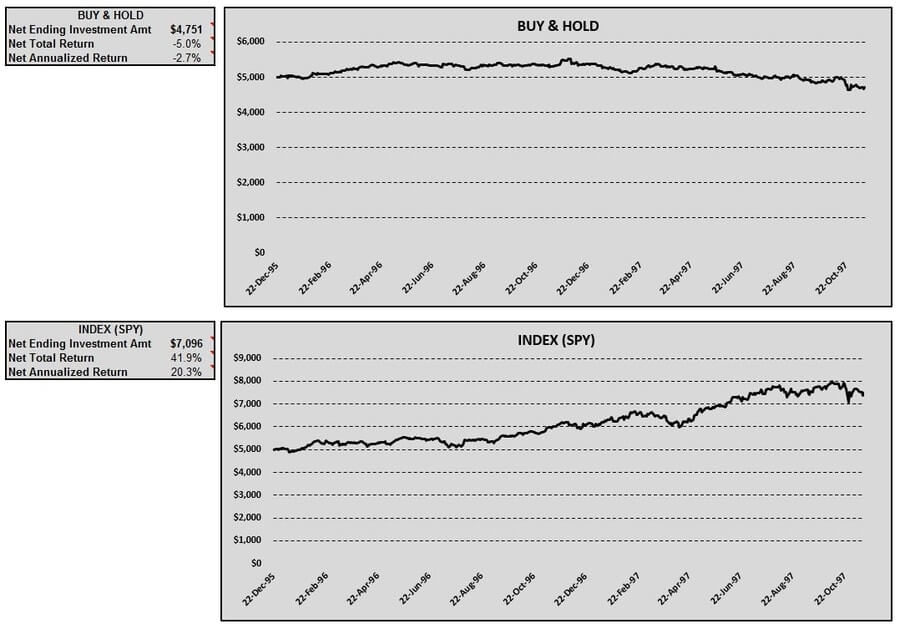
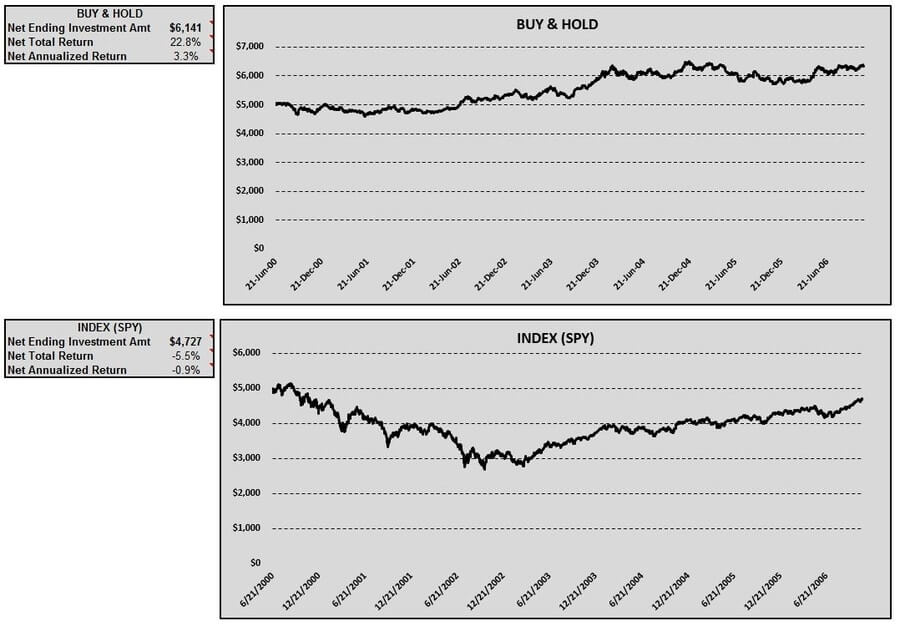
Buy & hold and indexing investing strategies – AUD/USD
As mentioned above – not many people are going to buy $5,000 of currency, hold it for a few years, and expect it to provide them with any meaningful return. So, the buy & hold investing strategy is merely presented for comparison purposes.
I suppose it warrants mentioning, however, that if someone did do something as unusual as buying & holding AUD for investment purposes – they would have come out way ahead. Way ahead when compared to the trading strategies anyhow. The buy & hold investing strategy would have returned to the “investor” a -2.7% net annualized return. Not good, but nothing compared to the financial drain realized by those using the trading strategies.
Next, we’re reminded that 2009 – 2017 isn’t the only bull market in history. The model period represented the lead-up to the “dot-com bubble.” The indexing investing strategy reflected as much by providing a 20.3% net annualized return. Obviously, this trounced all of the other strategies. Not even close.
Here’s how the buy & hold and indexing investing strategies tables and charts looked:
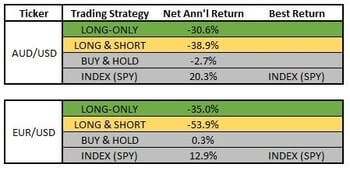
Coincident CCI indicator strategy return comparison – AUD/USD
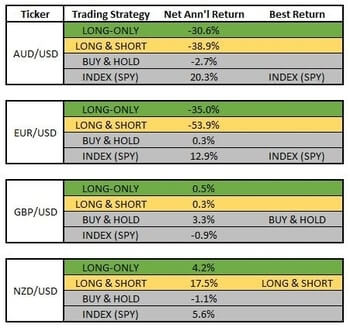
One model down and things are looking the same as they did for stocks, i.e. indexing is preferable to the trading with the coincident CCI indicator strategy. But, there’s a lot more to examine, so we won’t draw any conclusions yet. Here’s a recap of the net annualized returns for the AUD/USD currency pair:
EUR/USD – Euro / US Dollar
The model period for the EUR/USD currency pair is a short one – just one year. 5/24/2016 – 5/23/2017
Long-only and long & short trading strategies – EUR/USD
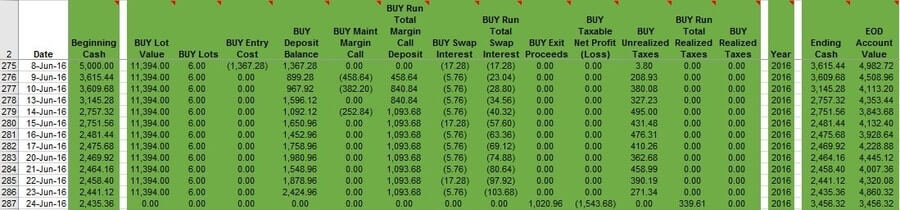
Well, it seems that a shorter model period doesn’t do much to alleviate the damage a coincident CCI indicator strategy can do to account value. More or less, right out of the gate, the long-only trading strategy racked up a $1,544 loss. On 6/8/16 a buy signal was generated at 1.1394. Just twelve trading days (and three margin calls) later, a sell signal was generated at 1.1117, a decline of 277 pips. Here’s a look at the details on that beating:
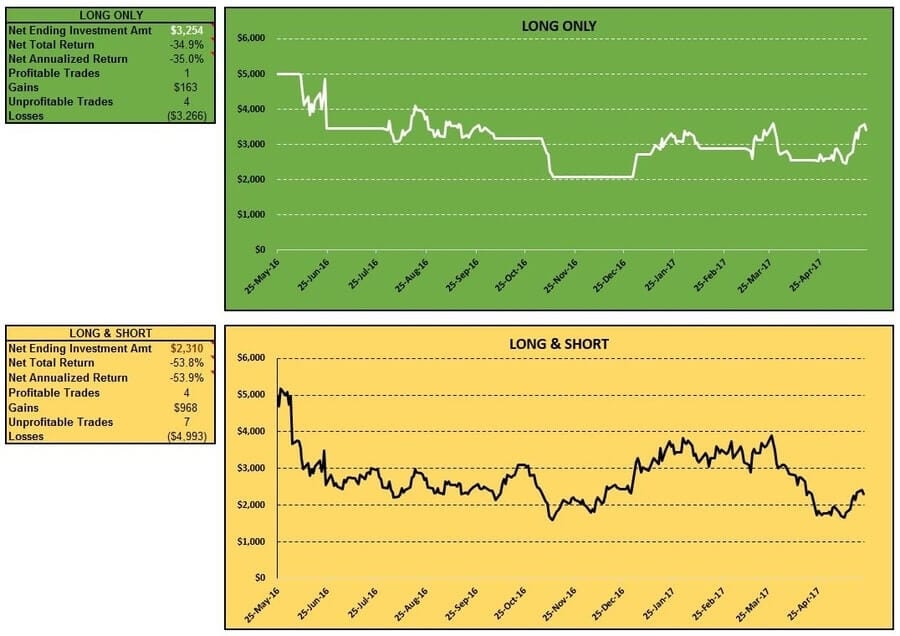
Account value for the long-only trading strategy bottomed out at $2,079 and rebounded some off of that low. Nevertheless, results were a very dismal -35.0% net annualized return.
Only 1 of 5 total trades were profitable, and that lone gain was worth only $163.
We know better by now than to expect that the long-short strategy did better; at least within the context of the coincident CCI indicator strategy. A -53.9% net annualized return was a trader’s reward for employing the long & short trading strategy. Like the long-only strategy, the account value barely got above the initial $5,000. There were some ups and downs over the one year model period, but the long & short strategy ended near its lows.
The ratio of profitable to unprofitable trades was a little better than the long-only trading strategy: 4 to 7. Those three short positions that closed for gains weren’t enough though. The losses were too big and the gains too little to make the long & short trading strategy worthwhile.
The effect of rollover interest – EUR/USD
Though this is a relatively short model period, rollover interest is always going to contribute positively or negatively to results. The long-only trading strategy was debited for -$648. That’s a -13% drag that the trading strategy would have had to overcome just to squeak out any profitability. On the long & short side, the total effect of rollover interest was -$265 or -5.3%. Also a drag, but not nearly what it was with the long-only strategy. The long & short trading strategy really only has itself to blame for its cataclysmic results.
Here’s a look at the long-only and long & short trading strategies tables and charts:
Buy & hold and indexing investing strategies – EUR/USD
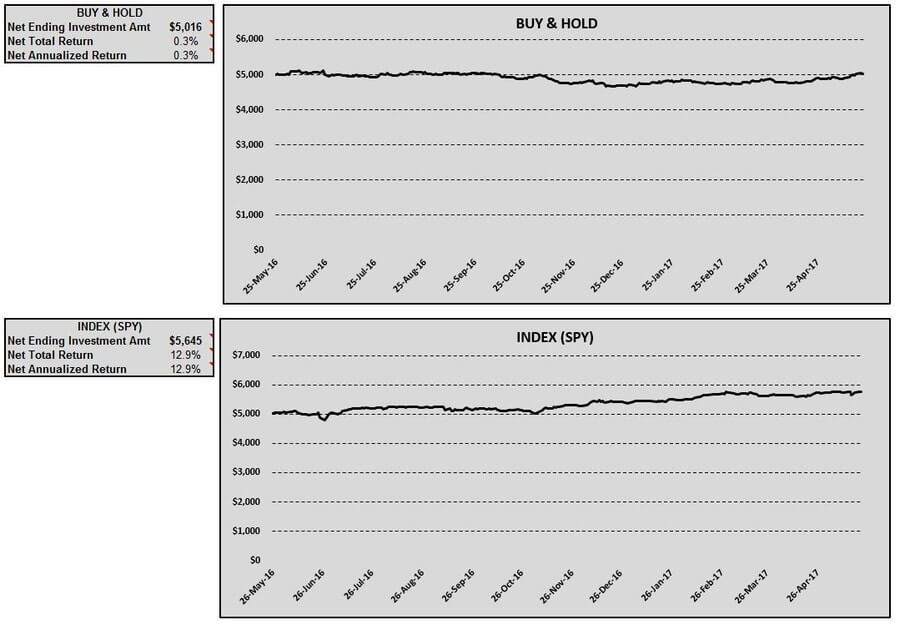
Buying & holding the EUR for the model period would have been the convoluted equivalent of sticking your money under your mattress. The net annualized return was 0.3%. The account value dropped to $4,662 throughout the year but rebounded toward the end of the model period.
Big surprise – indexing was the winner, with a net annualized return of 12.9%. Most of the gains from the indexing investing strategy came from the second half of the modeling period. Between Nov 2016 and May 2017 account value steadily increased and provided a nice little return on investment.
Here’s what the buy & hold and indexing investing strategies tables and charts looked like:
Coincident CCI indicator strategy return comparison – EUR/USD
The EUR/USD model was very similar to the AUD/USD model. Though the periods were almost two decades apart, indexing was still the most profitable trading strategy. Here’s how the models stack up thus far:
GBP/USD – British Pound / US Dollar
This time we’re going a little longer-term for the model period. The GBP/USD model will stretch from 6/21/2000 to 11/13/2006.
Long-only and long & short trading strategies – GBP/USD
Hey! Some not-so-shitty results finally! Not good, but not nearly as bad as we’ve seen before. The long-only trading strategy had a net annualized return of 0.5% over six and a half years. That’s nothing to write home about, surely, but it’s definitely better than the erosion of account value we saw on the above models. Actually, if a trader would have gotten out at the very top (which they never do) they would have netted $6,733 or a net annualized return of 8.5%. Obviously, most of those gains were given back.
The profitable trades still lagged behind the unprofitable ones at 12 and 16 respectively. Needless to say, gains were, on average, bigger than losses since the net ending investment amount was about flat.
The long & short trading strategy ended up very similar to the long-only with a nearly flat net annualized return (0.3%). It actually hit it’s high later in the model period – taking advantage of some GBP weakness. The peak account value was $8,157 and that was achieved with a little more than a year left in the model period. Unfortunately, after that, the account value took a hard fall into negative territory and then recovered in the last few months of the model period.
Also similar to the long-only trading strategy was the ratio of profitable to unprofitable trades – 26 to 31 respectively. Gains outweighed losses, on average, here too.
The effect of rollover interest – GBP/USD
Over such a long model period, rollover interest really took a toll. For the long-only trading strategy, the amount was -$2,240! That’s nearly half of the initial amount value! If no rollover interest needed to be paid, the long-only strategy would have returned 6.3% net annualized and would have been the most profitable strategy. Needless to say, especially over the long-term, rollover interest needs to be considered.
On the long & short side, a similarly large amount of rollover interest was paid out on the long positions – $2,503. (Why is it not the same? Consider that since short positions are being taken, the amount available to invest is going to be different than the long-only strategy. So, different numbers of lots can be purchased; therefore, different amounts of rollover interest will be owed) On the short positions, $1,578 was earned! That’s more like it! The net effect of rollover interest was -$925 or -18.5%. Nothing to sneeze at, but not nearly as devastating to returns as it was for the long-only trading strategy.
Here’s a look at the long-only and long & short trading strategies tables and charts for this model:
Buy & hold and indexing investing strategies – GBP/USD
As we’ve seen in the previous models, buying & holding currency is typically pointless. But, buying & holding GBP over this model period actually would have provided a reasonable return. Not great, but reasonable. The net annualized return was 3.3%, due to the increase in the value of the GBP from about $1.50 to 1.90. As is typical with currencies, the increase in value hasn’t been permanent and the current quote of GBP/USD is $1.34 (a/o 6/7/18).
In previous models (stock and forex) we’ve seen the indexing strategy take a hit and then recover. Not so in this model. The end of the dot-com bubble and the post 9/11 effects took a toll on the SPY over this model period. In the years since the market has more than rebounded, but for the purposes of this model, indexing was not the way to go. The indexing investing strategy had a net annualized return of -0.9%. Pretty uncharacteristic.
For our model period, here are the tables and charts for the buy & hold and indexing investing strategies:
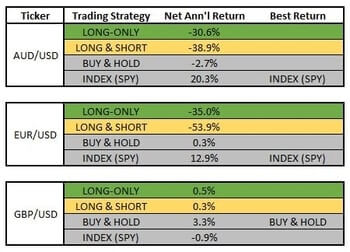
Coincident CCI indicator strategy return comparison – GBP/USD
Well, this is awkward…buying & holding was the best strategy. We’ll chalk that up as an outlier. I don’t imagine we’ll see that happen very often. But, it is what it is. Here’s the return comparison for the coincident CCI indicator strategy thus far:
NZD/USD – New Zealand Dollar / US Dollar
How about a really long-term model? The model period for the NZD/USD model will be 10/28/1996 – 8/2/2006.
Long-only and long & short trading strategies – NZD/USD
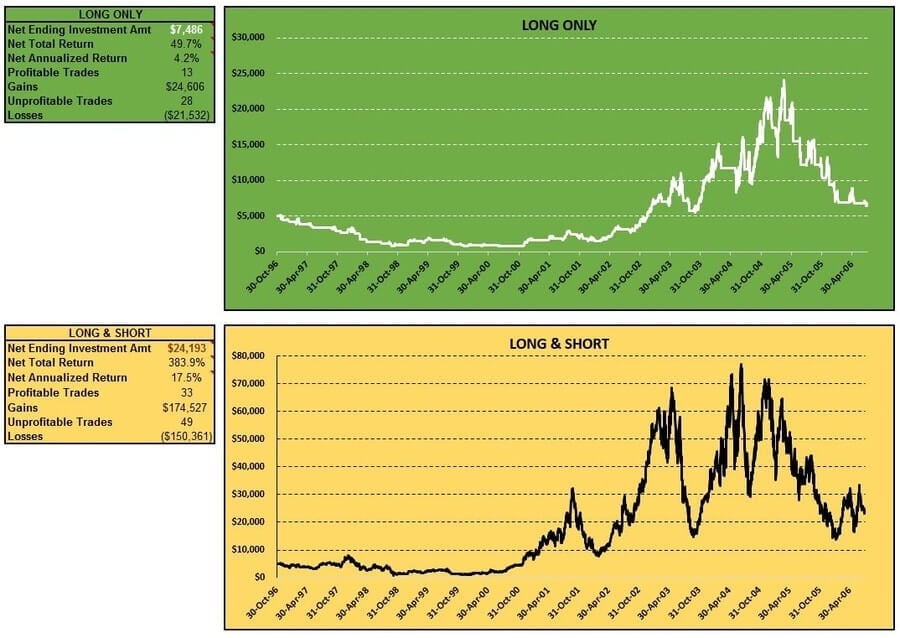
The long-only trading strategy did better within this model than it has with most others. The net annualized return was 4.2%. Most of those gains came later in the model period where, as the chart shows below, the account value really took off. It was Sep 1998 that the account value hit its low of $806. From there, the account value reached a high of $24,076 on Mar 2005. What that means is that for that six and half year period, traders would have earned a gross annualized return of 68.8%! Impressive by anybody’s measurement. Unfortunately, the long-only trading strategy gave most of that back.
Profitable trades lagged behind unprofitable ones (as they usually do with the coincident CCI indicator strategy) 13 to 25. But, when the signals were right, they were right big enough to make a positive difference.
Well, you know the story, right? The long & short trading strategy usually does worse? Not so in this case. The long & short strategy actually returned a very healthy 17.5%, net annualized, over the model period. If you thought the long-only trading strategy was a wild ride, it was nothing compared to this (see the total amount of gains and losses below). The account value was all over the place, especially in the second half of the model period. For simplicity’s sake, let’s look at the extremes. The low account value of $931 was hit in Oct 1998. The highest high was hit in Jul 2004 – when the account value got up to $77,047! For comparison purposes, this represents a gross annualized return of 115.2%! Crazy. Obviously, by the time things were said and done, a lot of those gains were also given back.
The profitable to the unprofitable ratio for the short signals was much more equitable. Short signals, under the long & short strategy, were profitable 20 times and unprofitable 21. Overall this trading strategy was only profitable 33 out of 82 times. Again, gains outpaced losses enough to provide a respectable net annualized return.
The effect of rollover interest – NZD/USD
What of rollover interest? Both the long and short rollover rates were going to work against the trader. For the long-only trading strategy, the total cost of rollover interest was $5,155 – well over the initial investment amount. So, that speaks to the effectiveness (in this model anyhow) of the coincident CCI indicator strategy. Over a nearly 10 year period, and in spite of 103% in interest paid, a net gain was still realized. $5,155 wasn’t anything compared to the total rollover interest incurred by a long & short trader. $30,329 was paid by someone employing that trading strategy! That’s what happens when gains are realized and more and more lots are purchased – bigger rollover expenses. Again, the net return in spite of opposing forces is impressive (and somewhat unexpected).
Here are the tables and charts for the long-only and long & short trading strategies:
Buy & hold and indexing investing strategies – NZD/USD
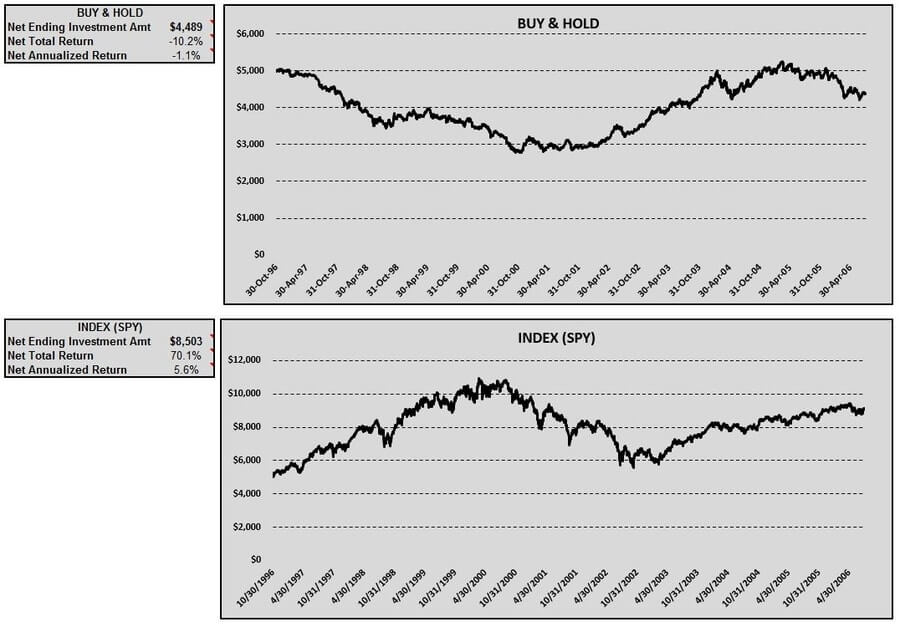
Whereas the buy & hold investing strategy for the GBP/USD currency pair provided a surprising return, the same can be said for the NZD/USD currency pair. Only the surprise was in the opposite direction. Buying & holding NZD would have eaten away a net total of -10.2% of your original investment, which comes to -1.1% on a net annualized basis. It could have been a lot worse, this trading strategy would have taken your account value down to $2,775 at one point throughout the model period. The model period is long, and a lot can happen over a long time, but this is a little more volatility than I’ve typically seen with currencies.
While the dot-com bubble did fall in the middle of this model period, since it started in 1996, the indexing investing strategy was able to enjoy some very healthy gains before that. On 3/24/2000, the account value hit a high of $10,937. It gave a lot of that back, but never went into the red. When all was said and done the indexing strategy returned a modest 5.6% on a net annualized basis.
Here are the buy & hold and indexing investing strategies charts and table for your viewing pleasure:
Coincident CCI indicator strategy return comparison – NZD/USD
Another curveball. The long & short trading strategy was the resounding winner in this model. Between all of the models completed thus far, these were by far the most unusual results. Anyhow, that’s it for forex models. Here’s how they all stacked up against each other:
Thoughts on using the CCI to trade Forex from actual traders
James with TheForexChronicles.com
What CCI settings (period & upper/lower limit) do you use to trade Forex? Different settings on intraday, daily, weekly charts? Do you even look beyond intraday?
I like to use 10 and 60-period CCI indicators and look for divergence on both of these indicators above the 100 level and below the -100 level. I don’t usually go below the daily chart.
Do you use the CCI in conjunction with another indicator? Which one(s)?
You can use other oscillating indicators such as RSI and stochastics, but you will often get the same signals. So I would suggest using the MACD indicator alongside the CCI indicator because this will make it easier to identify price reversals.
What’s the biggest pitfall to avoid for someone wanting to use the CCI indicator to trade Forex?
It is not really a profitable strategy to go short as soon as the CCI is above 100 or go long when it is below -100. It is much better to wait for divergence on this indicator because this will give you a clearer signal that a trend is running out of momentum and likely to reverse.
CCI indicator Forex
Results were all over the board. First, let’s start with the obvious – indexing is a coin flip. It’s great during bull markets. Easy, thoughtless money. That would be great if bull markets ran forever. But dot-com bubbles burst, catastrophes happen, and Great Recessions hit. Yes, the SPY always seems to recover, but it seems to be all about timing. If you’re counting on index funds to build your wealth, you had better hope that those dips come earlier than later. The SPY isn’t really the focus here, though. That’s simply where I stand on the matter after doing six stock models and four forex models.
So, what of the coincident CCI indicator strategy for forex? If you start delving into technical analysis, one piece of advice you’ll consistently see is: “trade with the trend, not against it.” All of the models completed thus far seem to back that up. The AUD/USD and EUR/USD currency pairs were very flat over their model periods. There was no real opportunity to utilize leverage to take advantage of moves upward or downward. So, the trading strategies got in and out of positions that didn’t really go anywhere and the account value got chipped away at. Returns were abysmal.
Contrast this with the GBP/USD and NZD/USD currency pairs which make pronounced moves upward and downward over their model periods. The coincident CCI indicator strategy (with the settings we used) didn’t take full advantage of these moves, but there was greater opportunity for profit since the underlying assets were actually moving.
Thinking back to the stock models
Our stock models didn’t use leverage. So, for instance, in the case of the Barnes Group (B) model, the long-only trading strategy performed well. Just not as well as buying & holding. The timing of the coincident CCI indicator strategy isn’t great – that’s obvious. So, there was no real advantage to getting in and out of B: you were better off just buying & holding. Conversely, with some of the stocks that tanked over the model period, we see the long & short trading strategy make gains in light of the stocks’ decline, but then get hurt by the long positions. It would be interesting to see how a short-only model would have worked with some of those poor performing stocks.
These results have given me food for thought going forward. I will definitely have to incorporate a trend component into some of the future models. Also, the addition of a short-only trading strategy seems in order. For now, I’ll finish what I planned, including similar models for futures and cryptocurrency. Those will be coming soon.