- A trend component was added to the futures models
- It helped the performance of the coincident CCI indicator strategy, but did not work miracles
- Indexing performed better than the trading strategies for all three models
- Using SLOPE to ascertain trends doesn’t do much to improve trading results for the coincident CCI indicator
Is the CCI effective as a coincident indicator for futures?
This is the third post examining the effectiveness of the coincident CCI indicator strategy.
The goal of these models is to see how technical indicators perform under different scenarios.
It’s one thing to look at a chart with a technical indicator on it and say “Ooh, look! If I would have bought here and sold here, I could have made money!” Great…but how much? What would have been the effects of taxes and fees (probably not as much as you think)? How would have that indicator strategy worked the trade before that? What about the trade after? Would you have been better off buying & holding or investing in an index fund? How about the settings for the indicator? Could you have done better?
There’s a lot of technical indicators to examine and a lot of variables to account for. So, as I try to get a better understanding of the answers to these questions, I’ll keep posting.
A note about my futures models
I’m somewhat sheltered. I’ve only ever traded stocks and options. I have never made a futures trade in my life. I’ve made quite a few financial models, though. As with forex, I did my homework and believe you’ll find these models to be a pretty accurate representation of futures trading.
Futures contracts don’t have lives that stretch over years (as far as I’ve seen). Plus, historic prices on futures contracts are very hard to find. So, I had to use the next best information I could find – historic spot prices. Models are just that – models. Not the real thing. But, I’ve attempted to create the next best thing for backtesting.
More detail on the coincident CCI indicator strategy
It dawned on me that I should illustrate the indicator strategy I’m using in these models a little more thoroughly. In the previous two posts, I linked to the inspiration for these models. That’s here, in the New Trend Emerging section.
This is the most simplistic CCI strategy that a trader can employ. I took the liberty of naming it “coincident” for lack of a better name. I chose that name because, during my research, many of the people I learned from stated that the CCI indicator should be used as confirmation for other indicators – not relied upon on its own. At this point, I can’t speak to that. But, I figured the name made a distinction from the other CCI indicator strategies (which I plan to cover at a later date).
Okay, what’s involved with the coincident CCI indicator strategy? If the CCI is above 100, then a buy signal is generated. That buy signal stays in effect until the CCI formula returns a value that is less than -100. At which point, a sell signal is generated.
But, there’s a new wrinkle – the trend
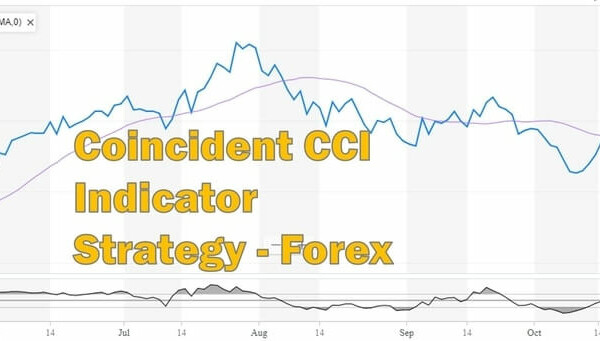
As I alluded to in the conclusion of my last post (coincident CCI indicator strategy for forex) I thought it might be beneficial to incorporate a trend component into the buy and sell signals. So, that’s what I did with the futures models.
Sure, we can all look at a graph and know if it’s trending up or down. How to quantitatively measure a trend, though?
First, I tried using a moving average over the same period used in the CCI calculation. That made for a lot of whipsaws between an up and downtrend, though.
What I settled on was using the SLOPE function in Excel to ascertain if the trend of the typical price was up or down. The lookback period is the same as the CCI indicator period, but there are much fewer whipsaws than with the moving average.
With the trend included, the buy and sell signals from the CCI formula must agree with the trend in order to actually execute a buy or sell trade in the model. If they don’t agree, a hold signal is generated and the previous position is closed and the model is out of the market until a new buy or sell signal comes up.
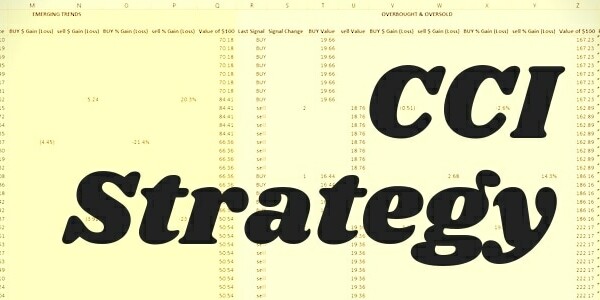
A look inside the guts of the model
Here’s what the worksheet looks like:
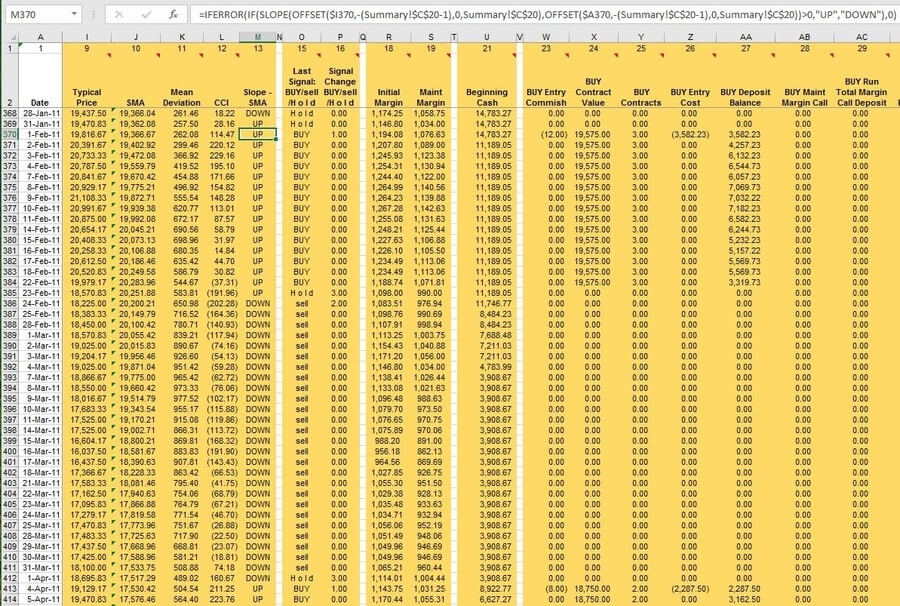
Notice on 1-Feb-11, that the CCI formula returned 114.47 and the trend (column M) was UP. In this case, a BUY signal (column P) was generated and 3 contracts were purchased.
On 23-Feb-11, the CCI formula returned -191.96. But, a sell signal wasn’t generated. Why? Because the trend was still up. It wasn’t until the following day, 24-Feb-11, that a sell signal was generated, because the trend moved DOWN.
This is a bit technical (it is technical analysis, after all), but hopefully sheds some light on what fuels these models.
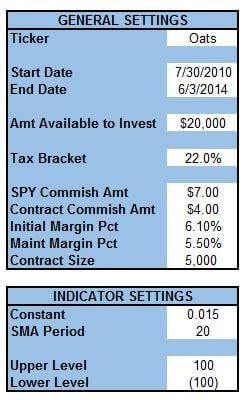
Coincident CCI indicator settings for futures models
Again, I’ve decided to go with the random start date, end date, and model period length.
The amount available to invest had to be bumped up to $20,000. This is more than a lot of people are going to have available to put into one single investment. Since the same “only 30% of the account value is used to enter positions so that plenty is left for margin calls” rule is being used here too, I had to make the starting amount big enough to account for that.
Short-term taxes are set at 22% and long-term at 15%.
The commissions are set at $7 for the SPY index and $4 per contract for futures trades. Since info on futures commissions was hard to find, I had to ballpark it and these were the best numbers I could find. I also rounded up a bit for the sake of conservatism.
Initial and maintenance margins are expressed as a percentage. Typically, they’re expressed as dollar amounts and are routinely updated. Since these models cover a longer timeline, it’s just easier to express margin amounts as a percentage. This is my reference when trying to come up with a reasonable initial and maintenance margin percentage.
Contract size, of course, will depend on the type of futures contract traded in the model.
Rough Rice, Oats, and No. 11 Sugar Futures
I had started this post before I plugged the historical data into the models. In retrospect, that was a mistake.
It’s the same ol’ story as it was with stocks and forex. The coincident CCI indicator strategy typically performs very poorly. Indexing, typically, brings better returns with less work. You didn’t come here for that, you can get that song and dance anywhere else.
But, the models have been made, so let’s take a look at them. I won’t go into as much detail as I did with stocks and forex because, as I said, there’s nothing much in the way of new insights.
Return comparison for coincident CCI indicator strategy
We’ll kick things off with a look at the return comparison across all three commodities:
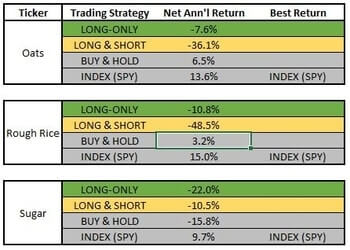
The best performing trading strategy was the long-only in the oats model; which had an astounding net annualized return of -7.6%. That’s sarcasm, of course.
You can also see that the buy & hold strategy consistently outperformed the trading strategies too. Obviously, buying and holding a futures contract, or the actual commodity over the course of years is not practical. It’s merely included for comparison purposes.
We’ve seen, in previous models, that the SPY tends to consistently post (near) positive returns. The degree to which the returns are positive depends on the model time period examined.
There were some points of interest in the futures models – so, let’s take a brief look at them.
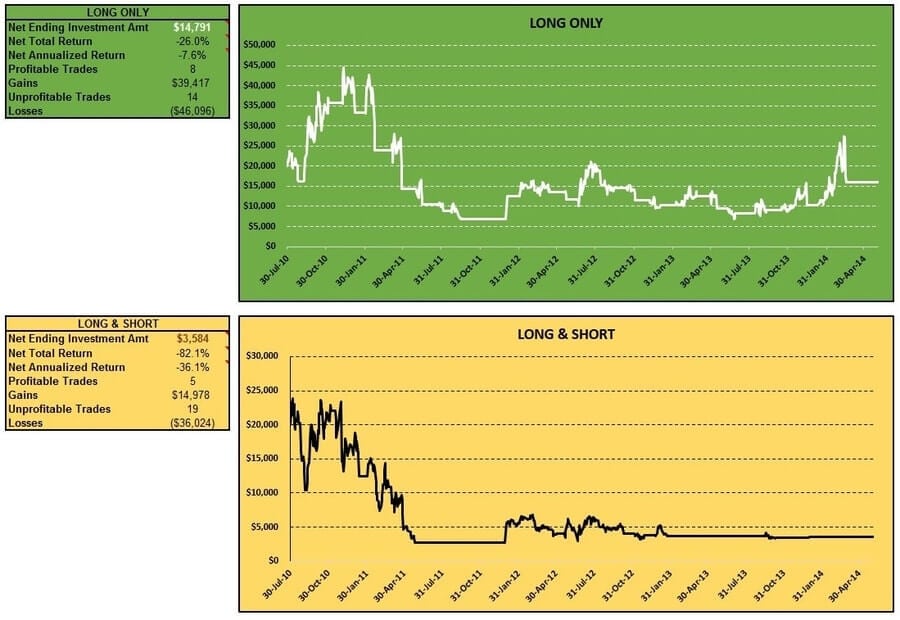
Oats futures
The model period for oats futures was 7/30/2010 to 6/3/2014.
Early, substantial, gains were realized in the long-only trading strategy. Those gains, and then some, were gone as quick as they arrived.
Both trading strategies were wrong much more than they were right.
The long & short trading strategy took such a beating in the first quarter of the model period that there wasn’t enough capital left in the account to do much trading in the last three quarters. That’s what’s happening when you see the long horizontal lines on the chart.
Bottom line is – aside from the initial spike, the coincident CCI indicator strategy was ill-suited for trading oats futures. At least it was in this time period with these settings.
Here are a look at the long-only and long & short trading strategies tables and charts:
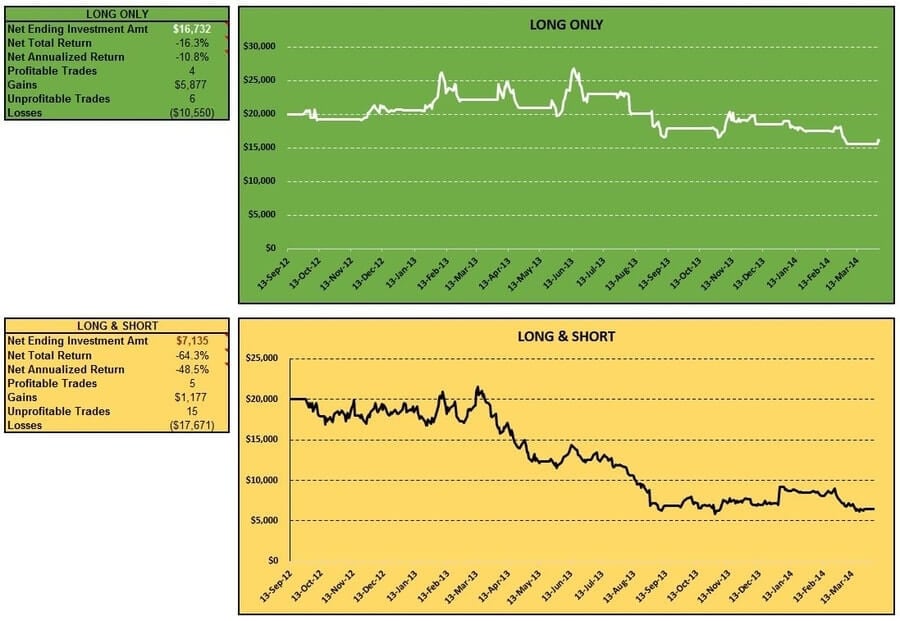
Rough rice futures
For rough rice, I looked at a model period between 9/13/2012 and 4/3/2014.
Not unlike oats, the long-only and long & short trading strategies for rough rice started out alright. As time went on, luck ran out and account value was deteriorated.
Here are a look at the long-only and long & short trading strategies tables and charts:
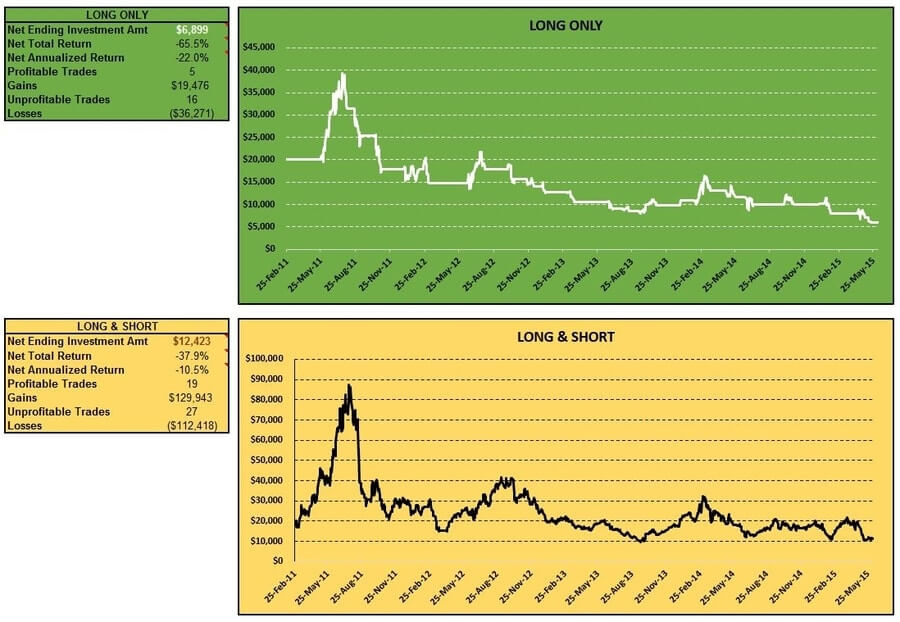
No. 11 sugar futures
The model period for sugar is 2/25/2011 to 6/8/2015.
I’d love to tell you that something different happened with sugar than the other two commodities. But, I can’t. Because, essentially, the same thing happened. A nice spike in account value initially followed by its gradual disappearance.
The long & short trading strategy did make a nice second rally up to about $40,000. But when all was said and done a -10.5% net annualized return was the trader’s reward.
If the model period for the long & short trading strategy had only been five months long, (i.e. the trader had gotten out on 7/25/11) they would have seen a net annualized return of 1,724.6%! Good stuff, but it wasn’t meant to last.
Here’s a look at the charts and tables for the long-only and long & short trading strategies:
Wrap-up for the coincident CCI indicator strategy
I haven’t seen anything encouraging in regards to this indicator strategy after running it through models for stocks, forex, and futures.
It seems to me that a trader stands to lose up to 3/4ths of their money employing the strategies I’ve examined thus far. Meanwhile, indexing beats the long-only and long & short trading strategies at least half the time.
Fortunately, there are a lot of different trading strategies to examine with a lot of different settings to employ. So, I’ll move on to a different CCI indicator strategy in my next post, which will focus on cryptocurrency.
Curiously, though, as I look back on the stock, forex, and futures models – it seems like with most trading strategies there was a point in the model period where the account value spiked. Sometimes it was early in the model period, sometimes it was late. But, it did seem to happen rather often. I suppose, if you had stop-loss orders in effect (and they didn’t get blown through) you might have been alright. At the very least you could have limited your downside.
Examining the effectiveness of stop-loss orders is an idea for another model for another time.
Meanwhile, adding the trend criteria for buy, sell, and hold signals in the futures model made me wonder exactly how much of an impact the trend had…
Thoughts on using the CCI to trade futures from actual traders
What’s the biggest pitfall to avoid for someone wanting to use the CCI indicator to trade futures?
Any indicator, whether technical or fundamental, provides information that you need to trade around. First, in our opinion, there is no exact point that will tell you where to get in; instead, it is an estimated entry. Over time as you use your favorite indicator, you will see to what degree it is lagging. Second, what matters most for any indicator or for that matter method is risk management.
For example, indicators can show an overbought or oversold area for a prolonged time while the price goes in a different direction. If you need to exit, then you exit. Everything has to be done in consideration of the account size, and a trader cannot let one trade “destroy” an account.
Different traders trade different sizes of capital and different time horizons. As such, they must take into consideration the volatility in the markets they trade, and if they use leverage (Futures Markets), then they have to consider what impact it has on their capital. (There is a substantial risk of loss in futures trading. Past performance is not indicative of future results).
Did adding the trend make for a better coincident CCI indicator strategy?
In my last post, with the forex models, I pondered the effect of adding a trend component to the criteria for buy and sell signals. As outlined above – I did just that.
Did it make a difference though?
I went back and added the trend criteria to 6 of the previous models. Here were the results:
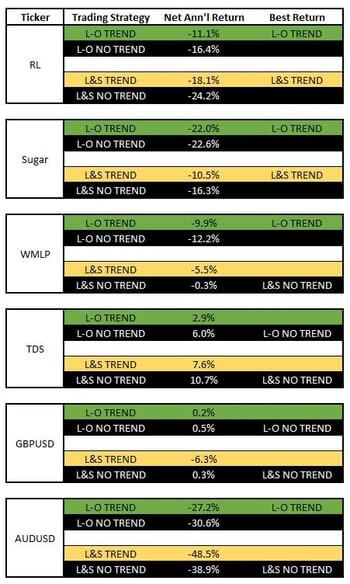
As you can see, the results were split. In the instances where adding the trend criteria improved results, it was merely a matter of making really bad results not-so-bad.
It might be that the method I use to quantify a trend is substandard. Earlier in the post, I mentioned that I used the SLOPE function in Excel. I know a lot of traders refer to an uptrend as higher highs and lows and a downtrend as lower lows and highs. If and when I can figure out how to quantify that – I’ll give it a whirl.
Join the conversation on Twitter!
Contents
- Is the CCI effective as a coincident indicator for futures?
- Thoughts on using the CCI to trade futures from actual traders
- Did adding the trend make for a better coincident CCI indicator strategy?