- Though crypto is volatile, the overbought & oversold CCI indicator strategy did not perform well at recognizing changes in prices
- Buying & holding was by far the most effective strategy over the past couple of years
- This indicator strategy made a poor showing but will be modeled against stocks before I give up on it completely
Can the CCI indicator tell us when a cryptocurrency is overbought or oversold?
This is the fourth post on CCI indicator strategies. Stocks, Forex, and futures have been examined. Now it’s time to model the new kid on the block – crypto.
The previous three models used the CCI as a coincident indicator. This means that its intent was to work alongside another indicator and provide decision-making support. Problem was, results were rather mixed. So, personally, I don’t think it proved to be accurate enough to be counted on. Like a friend or family member that you might ask for help in making important decisions – but has questionable judgment.
So, I moved on. For now, I’ll stick with the CCI indicator, but as far as what constitutes a buy, sell, or hold signal will change.
What constitutes overbought and oversold?
If you don’t know – the coincident CCI indicator strategy gave a buy signal when the CCI moved above 100. This signal stayed in effect until it went below -100, at which time a sell signal went into effect.
Things went a little different direction with the futures models. In the futures models, a trend component was added. This meant that the trend of the commodity had to agree with the CCI in order for a signal to be generated. If it didn’t, a hold signal went into effect and positions were closed and kept in cash until a buy or sell signal came about. The results here were also inconclusive. The trend helped returns about half the time and really hurt them the other half. In light of this, the trend component was dropped for these crypto models.
The overbought & oversold CCI indicator strategy I used in these models is based on this stockcharts.com post (the Overbought/Oversold section). Like the coincident strategy, this strategy is pretty simple and straightforward. It actually almost operates in the opposite way the coincident CCI indicator strategy did.
When the CCI figure moves above 100 and then below, the asset is considered to be overbought. A sell signal is given.
Conversely, when the CCI figure moves below 100 and then above, a buy signal is given.
Due to the nature of this strategy, and given that there is no trend component, there will never be a hold signal in these models.
Nope, I haven’t traded crypto either
Just as I confessed in my Forex, and futures posts – I’ve never traded this type of asset before.
But…
Also like I said before – the subject at hand is as much financial modeling as it is trading. And, I’ve done plenty of financial modeling before. I did my homework and these models are based on the best information I could find. If you see something that doesn’t look right (and you know what you’re talking about), drop a message in the comments and I’ll look into it.
A note about shorting crypto
The only cryptocurrency exchange I found that allows shorting was Bitmex. The way they did it, however, resembled a futures contract with a predetermined (by them) stop-loss price. This is fine and good but represented a very unique method of selling something short. Since this seems to be the way one particular exchange handles shorting and is not an industry-wide practice, I opted to treat shorting in a somewhat generic manner.
Basically, within the long & short trading strategy, if a sell signal is generated, then all of the cash available serves as collateral and the corresponding number of coins (for lack of a better term) are borrowed and sold. There’s no initial/maintenance margin or corresponding interest factored in.
When the day comes that shorting cryptocurrency becomes more commonplace, this is probably not how transactions will be handled. But, for my purposes (i.e. seeing how well these indicators can forecast downward price movements) it’ll work.
Overbought & Oversold CCI indicator settings for crypto models
Crypto just doesn’t have the history that the other asset classes do. So, these three models have a very short look-back period. Plus, all three cryptocurrencies performed similarly. Some “steady” gains in the time leading up to late 2017. At which time they realized tremendous gains and subsequently retreated back to earlier levels. Consequently, there’s not a lot of diversity in these models. But, this is what I have to work with.
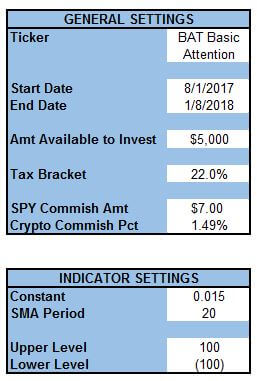
The Amt Available to Invest is back down to $5,000, from $20,000 in the futures models. This seems like a reasonable amount for someone to come up with if they were to try to make some money in crypto. In fact, it’s probably more than most people are willing to risk, but starting with $5,000 keeps it consistent with the stocks and Forex models.
Short-term tax rates are set at 22% and long-term at 15%.
The commission amount for indexing (SPY) is the usual $7.00. I set Crypto Commish Pct at a very hefty 1.49% based on information I found on Coinbase’s support page. It’s my understanding that other exchanges might have lower rates. But, this was the best information I could find and I thought that it represented a conservative approximation.
General indicator settings
The indicator settings are the same as they were for the coincident CCI indicator strategy models. I toyed with the idea of expanding the Upper Level and Lower Level to 200 and -200 respectively. This is what was suggested in the stockcharts.com article linked above. Particularly, it was suggested to do so with volatile investments, which crypto certainly is. However, I opted to leave these settings at 100 and -100. The reason being that my focus at this point is to explore the differences between CCI indicator strategies – not settings. I’ll explore the difference in returns between settings at a later point. Also, because the model periods are so short, (somewhat surprisingly) some of the cryptocurrencies never trigger a signal at 200/-200.
Here’s a look at the settings:
Basic Attention Token USD (BAT/USD)
BAT is barely a year old as of this writing. So, as I mentioned in the introduction – there’s not much to work with in the way of history.
The model period is a short five months – 8/1/2017 to 1/8/2018.
Long-only trading strategies – BAT/USD
“What? No long & short trading strategy results?” you might be saying. Nope. Afraid not.
The overbought & oversold CCI indicator strategy tanked when used in a long & short trading strategy. Specifically, the short side tanked.
Above, I mentioned how the model was set up to handle shorting for cryptocurrency. The problem is the overbought & oversold CCI indicator strategy performed so poorly that even if I backed off the amount borrowed, the account value still tanked – in all three models. The combination of this indicator strategy, shorting, and cryptocurrency just don’t seem to mix.
To top it all off, the way my models are currently set up, they’re really not designed to stop running when the account value goes negative. They keep plugging along, but things get screwed up with negative quantities used in transactions…everything’s inverse…and, frankly, it just all goes to hell. I might fix that someday, or I might just disregard any strategy that goes negative because it’s not really worth pursuing.
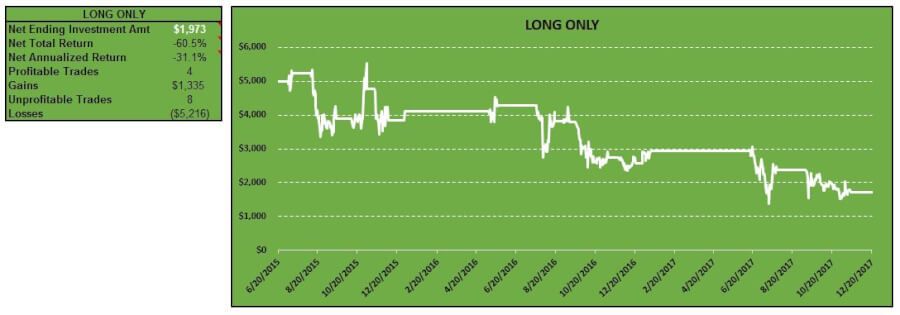
Enough about the catastrophic failures that were the long & short trading strategies, let’s touch on the long-only.
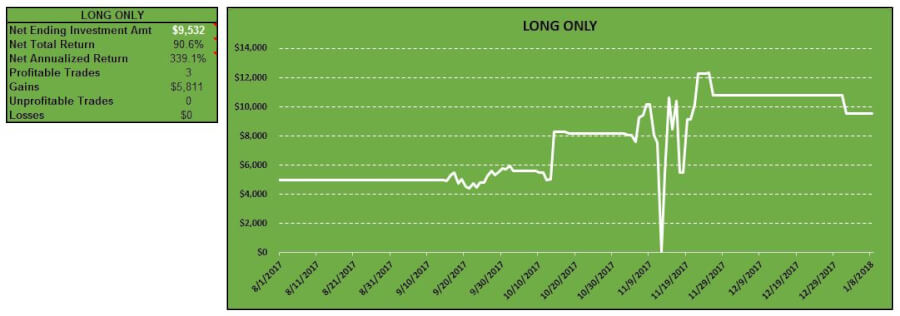
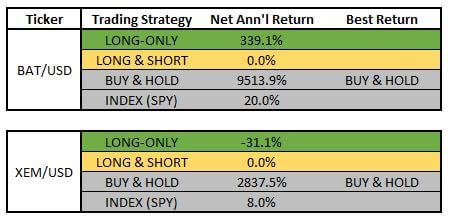
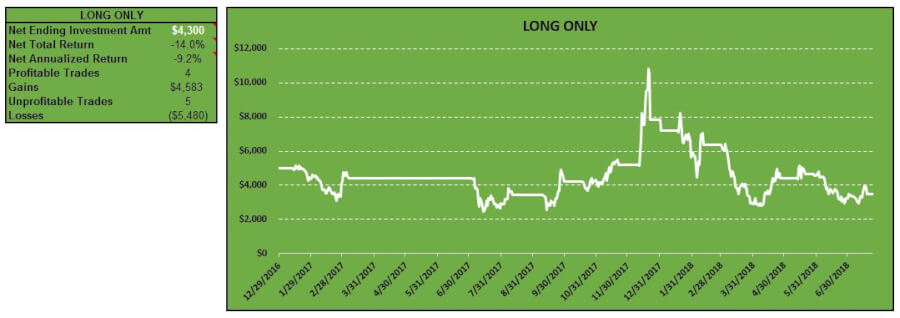
The Net Annualized Return was great, coming in at 339.1%. Obviously, given the nature of crypto and the short model period – take that with a grain of salt.
On 11/12/17, BAT dropped from $.1404 the previous day to close at $.0011. It rebounded to $.10 on 11/13/17. A quick glance at Google News on that day doesn’t really reveal why that happened.
The long-only trading strategy gave a trader rather volatile, but extraordinary returns over the model period.
Also worth noting is that long-only trading strategy was never wrong. Though the model period was short, this strategy was profitable 3 times and unprofitable 0 times.
Here’s a look at the long-only trading strategy table and chart:
“What if I would have kept trading until the present (7/24/18)?”
I wondered that myself, so to satisfy my curiosity, I plugged the numbers in. This new model period would have represented nearly a year’s worth of trading.
The long-only strategy would have, more or less given back all of its gains. The Net Ending Investment Amt was $5,255. Not quite as impressive as the original model.
What about the long & short trading strategy? Well…broke is broke. But, there’s what I call the short-sellers dilemma – “I know I’m right, but can I stay solvent long enough to realize it?” In this case, the short position that would have bankrupt the trader was entered at about $.19. In the time since the lowest BAT went was $.154 and is currently trading at about $.31.
As I said, when the account value goes negative, my model gets wrecked. And, we know that timing is everything in trading. But, with that being said, there’s no reason to believe that there’s any hope for the overbought & oversold CCI indicator strategy and a long & short trading strategy – at least as far as BAT is concerned.
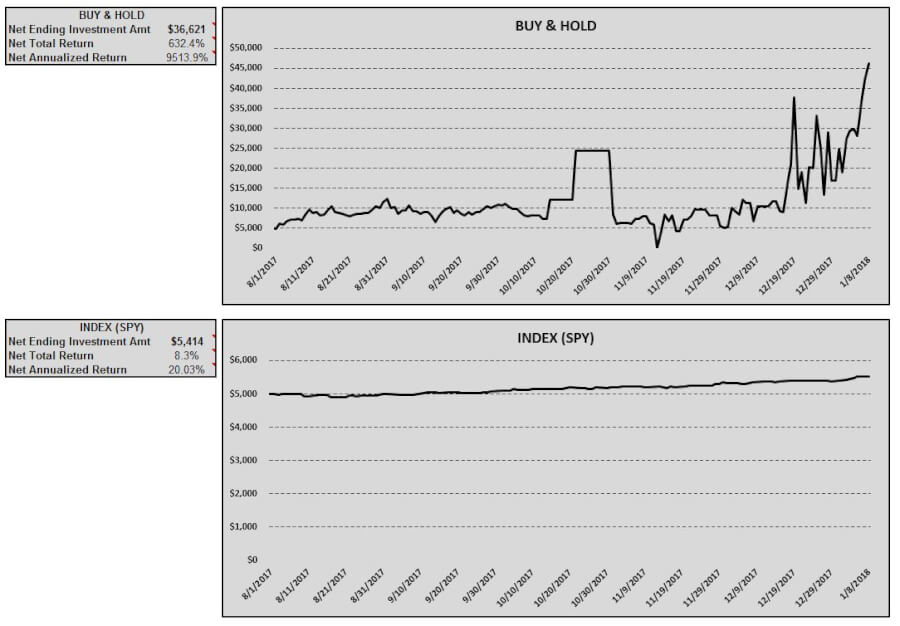
Buy & hold and indexing investing strategies – BAT/USD
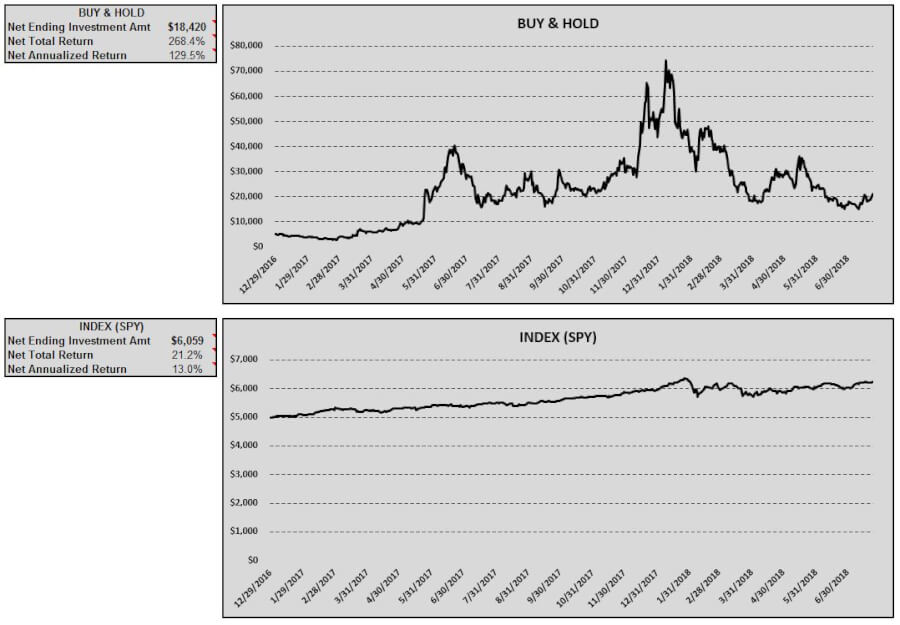
As we saw with some of the coincident CCI indicator strategies, whenever the long-only trading strategy had a good Net Annualized Return, it was likely that the buy & hold investing strategy did even better. With BAT, this was certainly the case. While 339.1% was great, the buy & hold investing strategy trounced that with a 9,513.9% Net Annualized Return.
What’s more, when BAT had that mysterious drop on 11/12/17, the buy & hold investing strategy account value hit a low of $44.30. Obviously, the rebound was fast and furious from there with the Net Ending Investment Amt ending up at $36,621.
Now, anybody that keeps tabs on crypto, even casually, knows that a lot of coins were hitting all-time highs at the beginning of 2018. So, this investing strategy benefits from the timing of the model period. But, it is what it is. If you were able to get into BAT on 8/1/17 and get out on 1/8/18 then you called it right and deserve everything you have coming to you.
Not much to say about the indexing investing strategy. The chart is boring, but the returns are solid. The Net Annualized Return was paltry when compared to the buy & hold investing strategy, but obviously very good for those who wouldn’t have dared to try to time the purchase and sale of BAT.
Here is a look at the buy & hold and indexing investing strategies tables and charts:
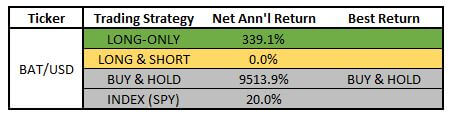
Overbought & Oversold CCI indicator strategy return comparison – BAT/USD
Buying & holding was the way to go with BAT. There’s plenty more to explore in terms of indicator and trading strategies, but here’s where the returns stand right now:
NEM (XEM/USD)
XEM has a little more of a history than BAT, so we can look at a longer model period.
The model period for XEM will be 6/20/2015 to 12/20/2017.
Long-only trading strategies – XEM/USD
Like BAT, the long & short trading strategy went haywire on account of the cryptocurrency moving up when holding a short position. The net result was that the account value went to $0 with the long & short trading strategy. So, again, we’ll just look at the long-only strategy.
The long-only trading strategy seemed to sit out all the huge run-ups in value. Oddly, it seems like buy signals were only generated when XEM made occasional moves to the downside. The Net Annualized Return for the long-only strategy was -31.1%, which is truly pathetic when you see how the buy & hold investing strategy performed.
Unprofitable trades outnumbered profitable ones 8 to 4 and losses were bigger in size than gains.
Here’s the table and chart:
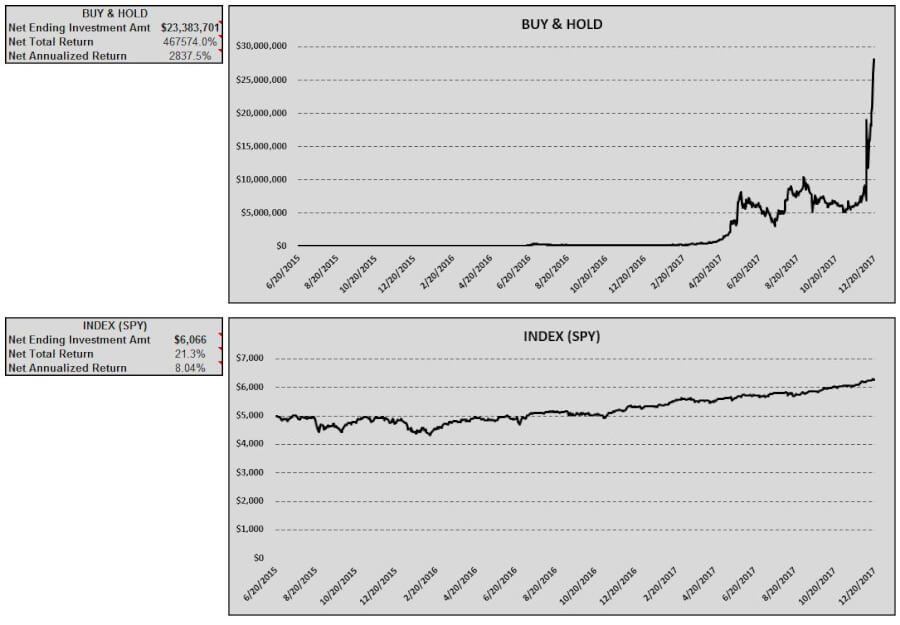
Buy & hold and indexing investing strategies – XEM/USD
No point in standing on ceremony.
Buying $5,000 worth of XEM on 6/20/15 and holding it for 18 months would have made you rich. Your Net Ending Investment Amt (after taxes and commissions) would have been $23.3 million. Not too shabby. For those who are curious, that’s a Net Annualized Return of 2,837.5%.
That’s the sort of thing that epitomizes cryptomania right there. When a cryptocurrency trades as low as $.000149 and hits a max of $.9826 (during the model period) you have the potential to make a shit-ton of money.
Though it doesn’t matter within the context of this analysis, XEM has come off of that high and now (7/27/18) trades around $.17. If you got in at around $.000149, you’re still a millionaire several times over.
Obviously, this blows the nips off of the indexing investing strategy. However, that strategy did give an investor a solid 8.0% Net Annualized Return.
Here’s a look at the tables and charts for the buy & hold and indexing investing strategies:
Overbought & Oversold CCI indicator strategy return comparison – XEM/USD
The trading strategies seem to have two things working against them. First, they’re wrong most of the time. Second, they’re not set up to take advantage of any sort of leverage.
Therefore, they’re getting blown out of the water by the buy & hold investing strategy.
One more cryptocurrency to look at.
ZCash (ZEC/USD)
This is the last cryptocurrency we’ll look at in this post because (spoiler) the results are more or less the same.
Anyhow, the model period for ZEC will be 12/29/2016 to 7/24/2018. This model is unique in that the model period extends beyond the crypto hype of early 2018 into the middle of this year.
Long-only trading strategies – ZEC/USD
You guessed it – the long & short trading strategy was rendered useless. On to the long-only strategy…
The long-only strategy had a nice run-up in value about halfway through the model period. But, it ended up giving it all back (and then some) after cryptomania subsided. The Net Annualized Return was -9.2%.
Gains and losses were relatively even. 4 profitable trades to 5 unprofitable ones.
Here are the chart and table for the long-only strategy:
Buy & hold and indexing investing strategies – ZEC/USD
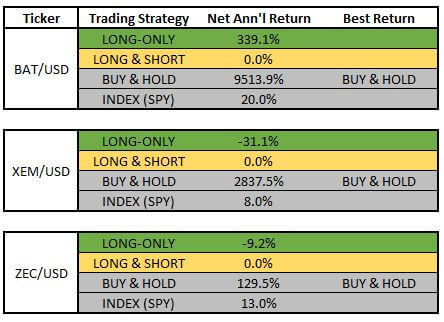
Even though the model period extended beyond the early 2018 spike in cryptocurrency values, the buy & hold strategy actually did really well. The Net Annualized Return was a very good 129.5%. This paled in comparison to the other two cryptocurrencies we looked at, but it was very good all the same.
Indexing did as expected, delivering a healthy 13.0% Net Annualized Return. Most of that came between the start of the model period and early 2018.
Here are the charts and tables:
Overbought & Oversold CCI indicator strategy return comparison – ZEC/USD
Buy & hold again.
Obviously, the long & short strategy was a dud. But, the long-only strategy only produced a profit in 1 of the 3 models. And, then, when it did, it paled in comparison to the buy & hold investing strategy. Indexing delivered its usual consistent returns. But the past few years have been a great time to hold cryptocurrency and the returns you would have enjoyed from doing so would have trounced about anything else you could invest in.
Here’s a look at the final return comparison for the overbought & oversold CCI indicator strategy:
Choose a better indicator for cryptocurrency trading
The crypto market is still young. So, there’s not a ton of data to work with.
One thing’s for sure, if you were intent on overthinking the crypto market over the past few years, you had better be damn sure you became a billionaire. The returns from buying & holding are so good, that beating them would be very tough.
We know now that the overbought & oversold CCI indicator strategy probably isn’t the way to beat buying & holding (if there is one). I won’t give up on it quite yet. Next week I hope to get a post out that tests its effectiveness on stocks. If that looks anything like crypto, I’ll probably dump it and look for a new indicator strategy to analyze for Forex and futures.