Updated 03/26/21
Feedback? Let me know on Twitter.
Some penny stocks might be substituted as they move above the $5.00 threshold. Also, those penny stocks that consistently have $0 in revenue or a lack of available financial information.
This is the most up-to-date financial information that could be found on Yahoo! Finance. No guarantee of accuracy is made.
What penny stocks are analyzed?
| Price | Financial Info Dated | Currency | Ticker | Company Name |
|---|---|---|---|---|
| $0.61 | 12/31/20 | USD | ACST | Acasti Pharma Inc. |
| $2.68 | 12/31/20 | BRL | ABEV | Ambev S.A. |
| $3.41 | 12/31/20 | USD | DS | Drive Shack Inc. |
| $0.80 | 9/30/20 | BRL | CTRM | Castor Maritime Inc. |
| $1.76 | 12/31/20 | USD | CIDM | Cinedigm Corp. |
| $1.07 | 12/31/20 | CAD | DNN | Denison Mines Corp. |
| $4.13 | 1/31/21 | USD | EXPR | Express, Inc. |
| $2.58 | 12/31/20 | USD | GNUS | Genius Brands International, Inc. |
| $0.01 | 12/31/20 | USD | GTLL | Global Technologies, Ltd. |
| $1.33 | 12/31/20 | USD | GSAT | Globalstar, Inc. |
| $0.00 | 12/31/20 | USD | HCMC | Healthier Choices Management Corp. |
| $2.75 | 9/30/20 | USD | IDEX | Ideanomics, Inc. |
| $4.85 | 12/31/20 | BRL | ITUB | Itaú Unibanco Holding S.A. |
| $1.80 | 9/30/20 | USD | JAGX | Jaguar Health, Inc. |
| $1.36 | 12/31/19 | USD | LKCO | Luokung Technology Corp. |
| $0.01 | 9/30/20 | USD | MAXD | Max Sound Corporation |
| $1.16 | 9/30/20 | USD | AIKI | AIkido Pharma Inc. |
| $0.00 | 1/31/21 | USD | MMEX | MMEX Resources Corporation |
| $0.77 | 1/31/21 | USD | NAKD | Naked Brand Group Limited |
| $4.01 | 12/31/20 | EUR | NOK | Nokia Corporation |
| $0.61 | 9/30/20 | CAD | NAK | Northern Dynasty Minerals Ltd. |
| $0.98 | 12/31/20 | USD | ONTX | Onconova Therapeutics, Inc. |
| $2.77 | 9/30/20 | USD | OPGN | OpGen, Inc. |
| $0.11 | 9/30/20 | USD | OZSC | Ozop Energy Solutions, Inc. |
| $1.07 | 9/30/20 | USD | SHIP | Seanergy Maritime Holdings Corp. |
| $2.69 | 12/31/20 | USD | SENS | Senseonics Holdings, Inc. |
| $4.78 | 12/31/20 | USD | SWN | Southwestern Energy Company |
| $3.31 | 12/31/20 | USD | RIG | Transocean Ltd. |
| $1.74 | 9/30/20 | USD | XSPA | XpresSpa Group, Inc. |
| $1.69 | 12/31/20 | USD | ZOM | Zomedica Corp. |
Note the Financial Info Dated and the Currency.
All dollar amounts below are in thousands, unless otherwise stated.
Pick high-performing penny stocks with revenue analysis
| Ticker | Company Name | Quarterly Rev Curr Qtr | Quarterly Rev Growth Q/Q | Annual Rev Curr Year | Annual Rev Growth Y/Y |
|---|---|---|---|---|---|
| ACST | Acasti Pharma I… | 81 | 100.0% | 0 | 100.0% |
| ABEV | Ambev S.A. | 18,556,600 | 18.9% | 58,379,000 | 11.0% |
| DS | Drive Shack Inc… | 60,287 | -9.3% | 219,987 | -19.1% |
| CTRM | Castor Maritime… | 2,791 | 7.9% | 5,968 | 50.7% |
| CIDM | Cinedigm Corp. | 9,954 | 38.6% | 39,291 | -26.6% |
| DNN | Denison Mines C… | 4,094 | 49.3% | 14,423 | -7.2% |
| EXPR | Express, Inc. | 430,335 | 33.6% | 1,208,374 | -40.2% |
| GNUS | Genius Brands I… | 274 | -51.1% | 5,908 | 494.7% |
| GTLL | Global Technolo… | 0 | 100.0% | 548 | 100.0% |
| GSAT | Globalstar, Inc… | 33,172 | 1.3% | 128,487 | -2.5% |
| HCMC | Healthier Choic… | 3,228 | -3.6% | 13,921 | -7.9% |
| IDEX | Ideanomics, Inc… | 10,620 | 126.3% | 44,567 | -88.2% |
| ITUB | Itaú Unibanco H… | 36,387,000 | 49.5% | 95,634,000 | -15.5% |
| JAGX | Jaguar Health, … | 2,773 | -12.4% | 5,775 | 30.8% |
| LKCO | Luokung Technol… | ? | 18,779 | -10.8% | |
| MAXD | Max Sound Corpo… | 0 | 100.0% | 0 | 100.0% |
| AIKI | AIkido Pharma I… | 0 | 100.0% | 9 | -96.9% |
| MMEX | MMEX Resources … | 0 | 100.0% | 0 | 100.0% |
| NAKD | Naked Brand Gro… | ? | 90,065 | -19.5% | |
| NOK | Nokia Corporati… | 6,553,000 | 23.8% | 21,852,000 | -6.3% |
| NAK | Northern Dynast… | 0 | 100.0% | 0 | 100.0% |
| ONTX | Onconova Therap… | 57 | -13.6% | 231 | -89.4% |
| OPGN | OpGen, Inc. | 1,057 | -11.0% | 3,499 | 18.8% |
| OZSC | Ozop Energy Sol… | 247 | 100.0% | 317 | 101.2% |
| SHIP | Seanergy Mariti… | 19,651 | 117.3% | 86,499 | -5.5% |
| SENS | Senseonics Hold… | 3,885 | 406.5% | 4,949 | -76.8% |
| SWN | Southwestern En… | 779,000 | 47.8% | 2,308,000 | -24.0% |
| RIG | Transocean Ltd. | 690,000 | -10.7% | 3,152,000 | 2.1% |
| XSPA | XpresSpa Group,… | 201 | 40.6% | 48,515 | -3.2% |
| ZOM | Zomedica Corp. | 0 | 100.0% | 0 | 100.0% |
Penny stocks are attractive, in part, because of their growth potential. Analyzing revenue growth helps you to identify those penny stocks that have the most potential. A high-growth company might not be a penny stock for long! Coupled with the margin and leverage analysis, you can decide which penny stocks you’d like to research further.
Learn more about analyzing revenue growth here.
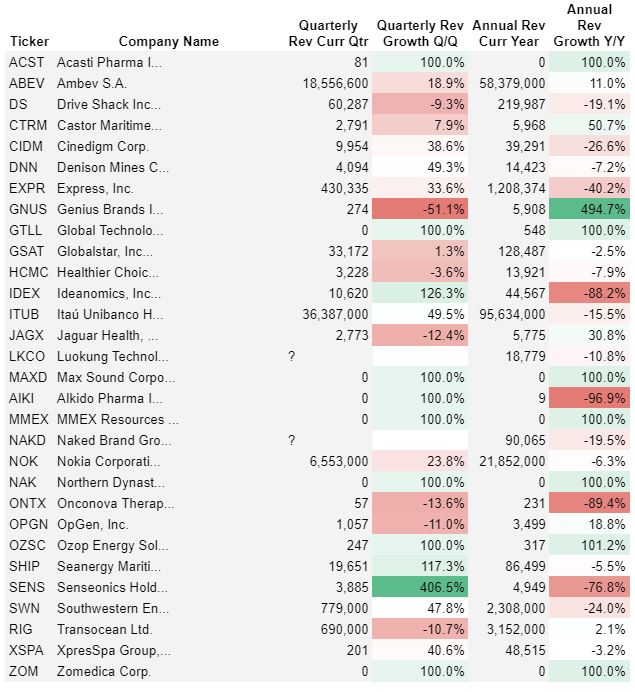
Quarterly Revenue Growth Q/Q looks at the most recent quarterly revenue amount and compares it to the previous quarter. For instance, this year’s Q2 revenue is compared to this year’s Q1 revenue.
Annual Revenue Growth Y/Y looks at the most recently reported fiscal year’s revenue and compares it to the previous fiscal year’s revenue. This is not revenue for the trailing twelve months (TTM).
Does your favorite penny stock have bad margins?
| Ticker | Company Name | Gross Profit Curr Year | Gross Margin | Operating Profit Curr Year | Operating Margin | Net Profit Curr Year | Net Margin |
|---|---|---|---|---|---|---|---|
| ACST | Acasti Pharma I… | 0 | 0.0% | -24,438 | 0.0% | -25,513 | -100.0% |
| ABEV | Ambev S.A. | 31,312,900 | 53.6% | 14,075,600 | 24.1% | 11,379,400 | 19.5% |
| DS | Drive Shack Inc… | 211,153 | 96.0% | -37,356 | -17.0% | -61,934 | -28.2% |
| CTRM | Castor Maritime… | 2,006 | 33.6% | 1,283 | 21.5% | 828,764 | 13886.8% |
| CIDM | Cinedigm Corp. | 22,145 | 56.4% | -4,349 | -11.1% | -15,090 | -38.4% |
| DNN | Denison Mines C… | 4,086 | 28.3% | -17,759 | -123.1% | -16,283 | -112.9% |
| EXPR | Express, Inc. | -4,907 | -0.4% | -455,215 | -37.7% | -405,449 | -33.6% |
| GNUS | Genius Brands I… | 1,339 | 22.7% | -6,506 | -110.1% | -14,862 | -251.6% |
| GTLL | Global Technolo… | 478 | 87.1% | -232 | -42.4% | -551 | -100.5% |
| GSAT | Globalstar, Inc… | 79,806 | 62.1% | -58,747 | -45.7% | -109,639 | -85.3% |
| HCMC | Healthier Choic… | 5,777 | 41.5% | -3,068 | -22.0% | -3,722 | -26.7% |
| IDEX | Ideanomics, Inc… | 43,109 | 96.7% | 10,190 | 22.9% | -98,508 | -221.0% |
| ITUB | Itaú Unibanco H… | 71,182,000 | 74.4% | 5,230,000 | 5.5% | 18,896,000 | 19.8% |
| JAGX | Jaguar Health, … | 1,959 | 33.9% | -24,948 | -432.0% | -44,726 | -774.5% |
| LKCO | Luokung Technol… | 3,803 | 20.3% | -31,517 | -167.8% | -31,513 | -167.8% |
| MAXD | Max Sound Corpo… | 0 | 0.0% | -622 | 0.0% | 12,121 | -100.0% |
| AIKI | AIkido Pharma I… | 0 | 0.0% | -5,685 | -63166.7% | -4,183 | -46477.8% |
| MMEX | MMEX Resources … | -214 | 0.0% | -1,153 | 0.0% | -4,394 | -100.0% |
| NAKD | Naked Brand Gro… | 33,818 | 37.5% | -26,346 | -29.3% | -54,305 | -60.3% |
| NOK | Nokia Corporati… | 8,193,000 | 37.5% | 1,026,000 | 4.7% | -2,516,000 | -11.5% |
| NAK | Northern Dynast… | 0 | 0.0% | -68,765 | 0.0% | -69,193 | -100.0% |
| ONTX | Onconova Therap… | 0 | 0.0% | -26,993 | -11685.3% | -25,153 | -10888.7% |
| OPGN | OpGen, Inc. | 1,867 | 53.4% | -10,971 | -313.5% | -12,446 | -355.7% |
| OZSC | Ozop Energy Sol… | 260 | 82.2% | -1,995 | -629.6% | -6,140 | -1937.7% |
| SHIP | Seanergy Mariti… | 19,862 | 23.0% | 12,884 | 14.9% | -11,644 | -13.5% |
| SENS | Senseonics Hold… | -17,366 | -350.9% | -79,130 | -1598.9% | -175,168 | -3539.5% |
| SWN | Southwestern En… | 1,005,000 | 43.5% | 16,000 | 0.7% | -3,112,000 | -134.8% |
| RIG | Transocean Ltd. | 2,371,000 | 75.2% | 188,000 | 6.0% | -567,000 | -18.0% |
| XSPA | XpresSpa Group,… | 10,661 | 22.0% | -9,782 | -20.2% | -21,223 | -43.7% |
| ZOM | Zomedica Corp. | 0 | 0.0% | -16,765 | 0.0% | -16,912 | -100.0% |
Penny stocks aren’t exactly known for their profitability. However, there are many that have healthy gross, operating, and net profit margins. The more revenue that a penny stock can carry to the bottom line, the bigger your profit potential!
Learn more about margin analysis here.
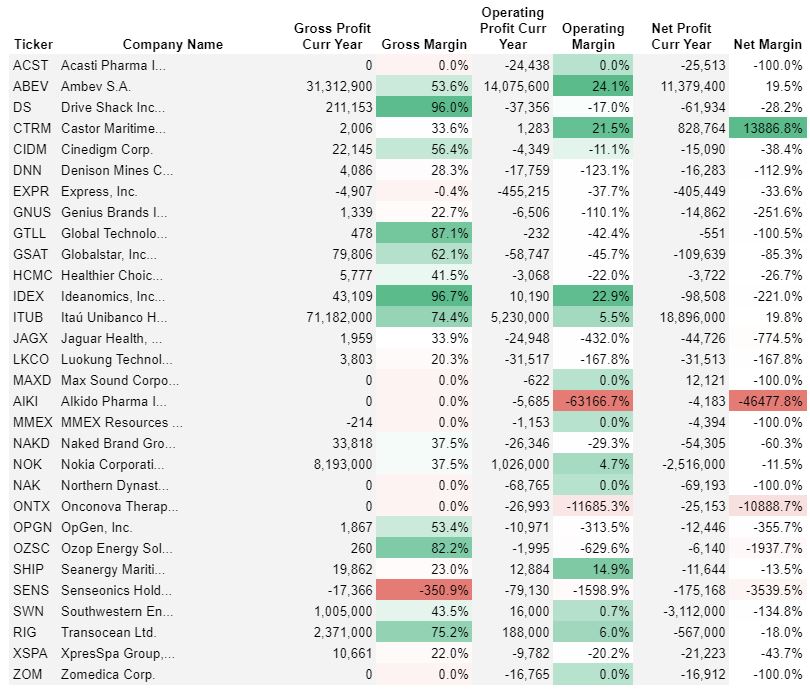
Gross Margin = Gross Profit Curr Year ÷ Annual Rev Curr Year. Gross margins can vary widely by industry. Typically, high gross margin industries are more desirable than low gross margin industries. If a company has a negative gross margin that might mean that they have poor pricing strategies. Or, that they have little control over their cost of goods sold (COGS)/cost of sales (COS).
Operating Margin = Operating Profit Curr Year ÷ Annual Rev Curr Year. If gross margins are bad, then operating margins will probably be worse. If a company is young and dumping a lot of money into marketing or R&D – those investments might pay off big time! On the other hand, if most operating expenses consist of salaries for upper management then that particular penny stock might be a dud.
Net Margin = Net Profit Curr Year ÷ Annual Rev Curr Year. Net margin is the percentage of revenue carried down to the bottom line. It’s the profit available to shareholders (like you!) after taxes and interest are paid. Sometimes, other expenses or income can make the Net Margin erratic. A penny stock doesn’t necessarily need to have a positive Net Margin to qualify as a good investment. If it’s a viable company, it should, someday, turn a profit.
What would a 50% change in revenue mean for your penny stock?
| Ticker | Company Name | Degree of Operating Leverage | Interest Expense Current Year | Degree of Financial Leverage |
|---|---|---|---|---|
| ACST | Acasti Pharma I… | -0.3 | 247 | 1.0 |
| ABEV | Ambev S.A. | -1.2 | 1,786,600 | 1.1 |
| DS | Drive Shack Inc… | 1.5 | 10,968 | 0.8 |
| CTRM | Castor Maritime… | 0.6 | 222 | 1.2 |
| CIDM | Cinedigm Corp. | 0.8 | 7,258 | 0.4 |
| DNN | Denison Mines C… | 3.7 | 3,175 | 0.8 |
| EXPR | Express, Inc. | -85.3 | 0 | 1.0 |
| GNUS | Genius Brands I… | 0.0 | 807 | 0.9 |
| GTLL | Global Technolo… | 0.1 | 1,638 | 0.1 |
| GSAT | Globalstar, Inc… | 2.7 | 48,429 | 0.5 |
| HCMC | Healthier Choic… | 2.8 | 273 | 0.9 |
| IDEX | Ideanomics, Inc… | 1.6 | 5,616 | 2.2 |
| ITUB | Itaú Unibanco H… | 5.4 | 0 | 1.0 |
| JAGX | Jaguar Health, … | -0.1 | 5,731 | 0.8 |
| LKCO | Luokung Technol… | -17.8 | 102 | 1.0 |
| MAXD | Max Sound Corpo… | -0.6 | 1,103 | 0.4 |
| AIKI | AIkido Pharma I… | -0.3 | 0 | 1.0 |
| MMEX | MMEX Resources … | -0.4 | 1,847 | 0.4 |
| NAKD | Naked Brand Gro… | 0.5 | 5,213 | 0.8 |
| NOK | Nokia Corporati… | -1.1 | 235,000 | 1.3 |
| NAK | Northern Dynast… | 0.0 | 134 | 1.0 |
| ONTX | Onconova Therap… | -0.3 | 0 | 1.0 |
| OPGN | OpGen, Inc. | -0.9 | 188 | 1.0 |
| OZSC | Ozop Energy Sol… | 0.4 | 2,173 | 0.5 |
| SHIP | Seanergy Mariti… | -1.1 | 14,801 | -6.7 |
| SENS | Senseonics Hold… | 0.5 | 16,167 | 0.8 |
| SWN | Southwestern En… | 3.9 | 94,000 | -0.2 |
| RIG | Transocean Ltd. | -139.0 | 575,000 | -0.5 |
| XSPA | XpresSpa Group,… | 11.2 | 2,900 | 0.8 |
| ZOM | Zomedica Corp. | -0.2 | 1 | 1.0 |
Penny stocks, like anyone, can earn extraordinary returns from leverage. Leverage can take two forms for a company – operating and financial. Leverage is a double-edged sword, however. It can hurt as much as it can help.
Learn more about operating leverage here.
Learn more about financial leverage here.
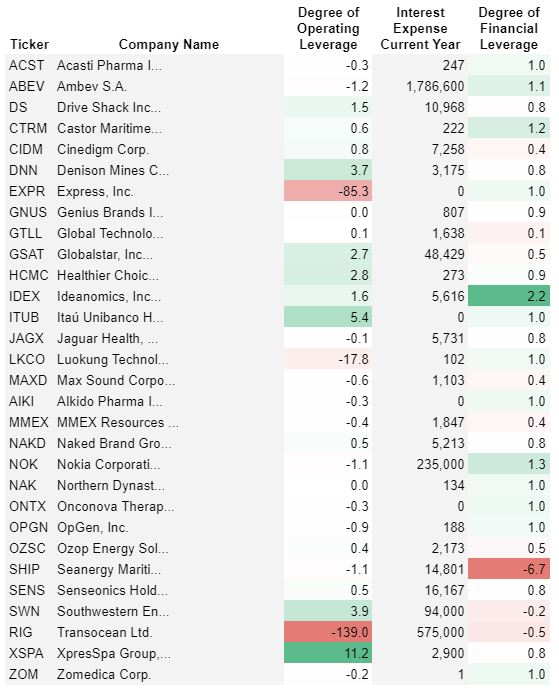
Degree of Operating Leverage is measured by comparing the change in Operating Profit to the Change in Annual Revenue. For example, if a company has a Degree of Operating Leverage of 1.5, then a 50% increase in Revenue would be expected to result in a 75% increase in Operating Profit (50% × 1.5). The reverse is also true. A 50% decrease in Revenue would be expected to result in a 75% decrease in Operating Profit (-50% × 1.5)!
Degree of Financial Leverage is measured by comparing Operating Profit to Interest Expense. For example, if a company has a Degree of Financial Leverage of 1.1, then a 50% increase in Operating Profit would be expected to result in a 55% increase in Net Profit (50% × 1.1). Again, the reverse is also true. A 50% decrease in Operating Profit would be expected to result in a 55% decrease in Net Profit (-50% × 1.1)!
Learn even more about leverage, plus other useful ratios to analyze here.