A short-selling spreadsheet will help you, as an investor, to understand your margin requirements and your potential profit at different prices. Download a short-selling spreadsheet below or follow along to make your own.
This post assumes that you are familiar with the basics of short selling and the accompanying margin requirements.
If you’re not, read this post.
Download a completed short-selling spreadsheet
Complete the form below and click Submit.
A link to the Google Sheet will be emailed to you.
Once you’re in the spreadsheet, click on File > Make a copy to edit. I’ll no longer be responding to “Requests for access.”
How is short selling calculated?
Truly understanding how short-selling works requires an investor to understand how the variables are calculated.
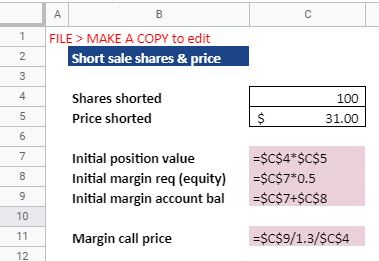
Margin call price
The first step in calculating the Margin call price is to calculate the Initial position value. This is the gross proceeds from the short sale of the stock
Initial position value = Shares shorted × Price shorted
Since short selling is on margin, there will be an Initial margin requirement.
Initial margin req (equity) = Initial position value × 50%
In order to know the Margin call price, we have to calculate the Initial margin account balance.
Initial margin account bal = Initial position value + Initial margin requ (equity)
Now, we can calculate the Margin call price. The price at which, you the short-seller, would receive a margin call if the stock moved against you.
Margin call price = Initial margin account bal ÷ 130% ÷ Shares shorted
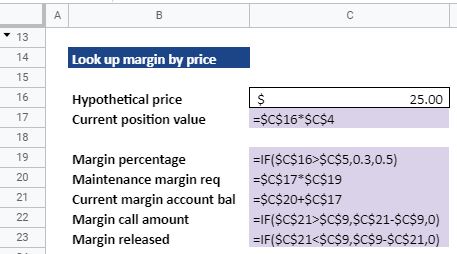
Margin call amount & margin released
With these calculations, we can see what the effect on margin will be when the price of the stock changes.
The first thing to calculate is the Current position value based on the Hypothetical price.
Current position value = Hypothetical price × Shares shorted
The Margin percentage changes depending on whether the price of the stock has risen or fallen. It will lower to 30% if the price of the stock rises and stay at 50% if the price of the stock goes down.
The Margin percentage must be calculated in order to know the Maintenance margin requirement.
Maintenance margin req = Current position value × Margin percentage
The last calculation we need to make before we can determine the Margin call amount or the Margin released is the Current margin account balance.
Current margin account bal = Current position value + Maintenance margin req
If the Current margin account balance is above the Initial margin account balance, then a Margin call will take place. If it is below, then margin will be released. Remember that the Margin percentage will lower to 30% if the stock rises.
See the How do you short sell in Excel section (below) for more info.
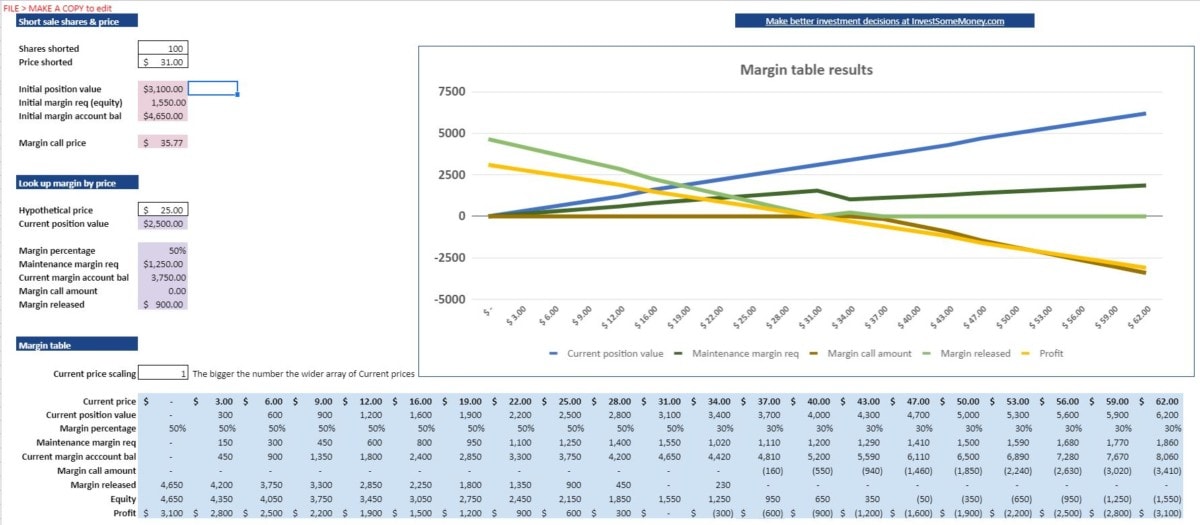
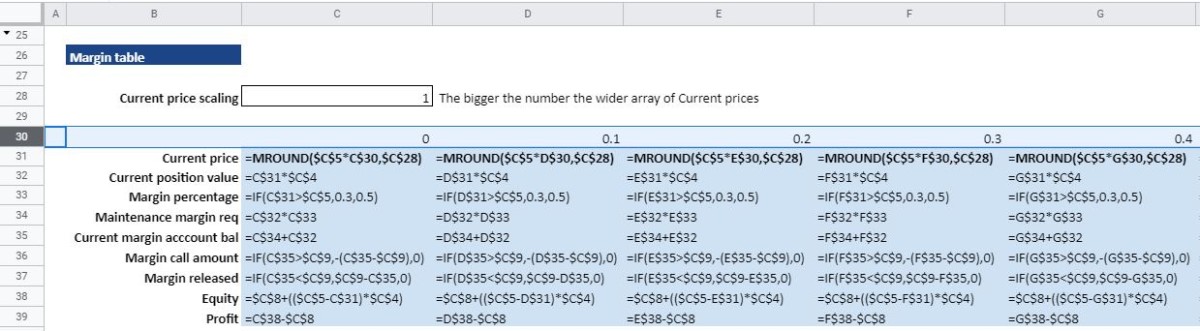
Margin table
A lot of the information in the Margin table is the same as that previously calculated. There are two additional pieces of information I’ll address – Equity and Profit.
Equity = Initial margin req + (Price shorted – Current price) × Shares shorted
Profit = Equity – Initial margin req
How do you enter short-selling calculations into Excel?
The previous section explained the context behind the short-selling calculations. Here, you can see how I entered those calculations into an Excel spreadsheet. In, truth, I used Google Sheets, but you can copy what I did into Excel and the result will be the same.
If you’d rather not enter these formulas yourself, you can download my completed spreadsheet above. Once you have access to the spreadsheet, click on FILE > DOWNLOAD > MICROSOFT EXCEL (.XLSX).
Here are the formulas entered to calculate the Margin call price based on the Shares shorted and Price shorted.
Look up margin by price
These formulas will allow you to see what the Margin call amount or Margin released would be at a Hypothetical price.
Margin table formulas and chart
As mentioned previously, the margin table shows, essentially, the same information as calculated above – with the exception of Equity and Profit. The margin table allows you to see the change in values across 21 different prices. These prices will change based on what’s entered into the Price shorted field (C5).
Note the values entered into row 30 on my spreadsheet. They are necessary for the margin table to function as intended. I ordinarily keep this row hidden, once the spreadsheet is complete.
Since there is so much information in the margin table, I can’t fit all of the formulas into a readable screenshot. So, here are the first few columns. Hopefully, you can see the pattern and recreate it if you’re following along in Excel.
The chart illustrates the data in the margin table. This is one aspect of Google Sheets that is quite a bit different than in Excel. Here is the chart setup in Google Sheets, if you’re interested.
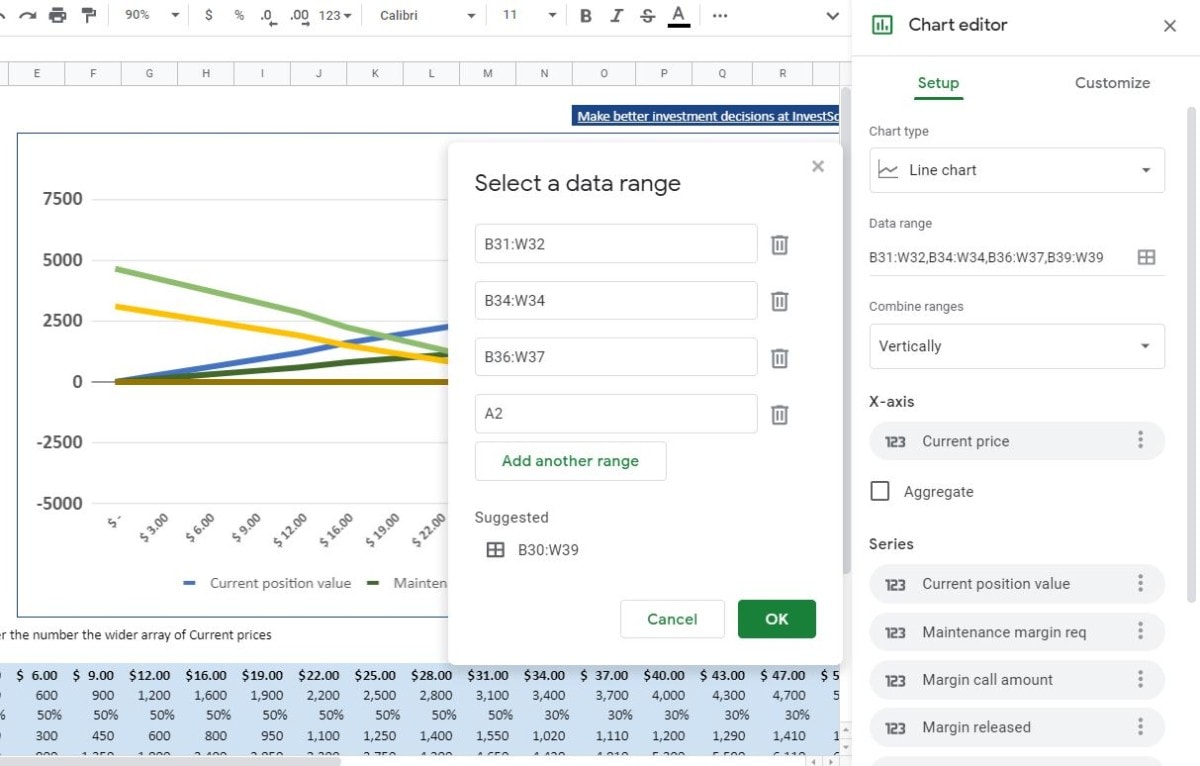
To recreate it in Excel, highlight the following (field names and data):
- Current price
- Current position value
- Maintenance margin req
- Margin call amount
- Margin released
- Profit
Then, select INSERT > RECOMMENDED CHARTS. This should give you a few options on the format of the chart. You’ll probably want a line chart as I have in my example.
What is a short-selling example?
In this video, titled “How to Short Sell with Fidelity – Full Example” Jake Broe walks through entering a real-life short sale on Fidelity’s trading platform. This is a good, practical, example of applying everything that has been modeled in Excel up to this point.
Here are some of the highlights of the video if you’d like to jump ahead:
0:22 Specifies that you need to have a margin account to sell short
2:06 How to navigate to the short sale trading screen
2:23 An example of trying to short an intelligible stock (GameStop Corp. GME
3:15 An example of shorting a “hard to borrow” stock (American Airlines Group Inc. AAL)
4:06 An example of a normal Sell Short order (Bank of America Corporation BAC)
4:27 Recommends limit orders for short sales
5:08 Explanation of the proceeds he will receive from the short sale
6:10 What the Positions screen looks like after execution of the trade
6:45 How the short sale will become profitable
7:25 Closing out the short position
8:07 What the Positions screen looks like after closing the short position
8:12 Calculating the profit/loss of the example short sale
8:41 A comparison of selling short in Fidelity vs Schwab and Vanguard


YES PLEASE