A good investment portfolio is one that meets your needs in terms of return, volatility, and time horizon. Tools, like spreadsheets, can measure these factors. A good investment portfolio today might not meet your needs in the future. Creating a good investment portfolio means selecting the right assets from the appropriate classes. Analyzing your investment portfolio in such a manner will help you “sleep soundly.”
With the worksheet (download below) you can specify the amount of your investment, leverage, and you can even test the effects of additional volatility. Based on the historical data, you can decide if this asset allocation works for you.
Building an investment portfolio | what to consider?
- Where you are and where you want to go financially
- Your goals
- Your risk tolerance
- Your timeline
- What investments do you understand?
- What investments must you own?
- How often will you reexamine your portfolio?
- Will you manage it actively or passively?
- What are you measuring performance against?
- How much can you tolerate losing?
- How concentrated/diversified do you want to be?
- What is in/out of your control?
- Do you have an “emergency fund?”
- Should you pay off debt first?
- Does your employer match retirement contributions?
- Do you need an advisor?
Whether the market’s going up, down, or both ways, it pays to have a portfolio that you don’t lose sleep over. If you handle your own investments, you need to have a plan about how you’re going to allocate assets in that portfolio. Your goals are your own. Your portfolio should be a reflection of those goals.
Of course, we all want a nice return on our portfolio. But, there are other things to take into consideration. For instance, what types of investments do you understand? You shouldn’t have anything in your portfolio that you can’t wrap your head around.
Another thing to consider is the amount of money you have to invest. Some investment opportunities are too costly to add to your portfolio.
Also, you probably shouldn’t have anything in there that stresses you out. All investments will cause concern from time to time. Whether it be fear of missing out (FOMO) or fear of losing it all. However, if you’re consumed by the perceived risk of a particular investment, it’s detrimental to your quality of life. Even if that investment earns a good return.
The boilerplate advice for constructing a portfolio is to make it well diversified. X% of stocks and y% of bonds. It all depends on your age. That’s just advice for the average person, however. You’re not average.
Let’s go over some ways you can determine what you’re comfortable with, and what you’re competent at in order to create an ideal investment portfolio.
What asset allocation works for you?
- Consider the following:
- Subtract your age from 110
- Consider putting that percentage into stocks.
- The rest into fixed income.
- Will you use the money for something specific?
- Do you need access to cash now?
- Will you need your investments for income?
- Does the volatility of certain investments scare you?
- Are you concerned about inflation?
- Are you willing to analyze/invest in foreign stocks?
- Are you comfortable owning real estate or commodity investments?
- Subtract your age from 110
Here are some things to consider when answering this question.
1) What do you want to use the money for?
Do you have a specific goal in mind, or are you just trying to build wealth? Are you someone in their 20s or 30s with a long time horizon? Or, are you in your late 50s/early 60s with a not-so-long horizon?
2) What do you understand?
Maybe you can analyze stocks with the best of them. But, do you know how to trade options? Are you even interested in doing that? How about futures? Or Forex? Crypto?
If there’s something you’re interested in adding to your portfolio but don’t yet understand, leave it off for now. Educate yourself first. There’s plenty of resources out there (and on InvestSomeMoney.com!).
3) How much do you want to allocate to each asset class?
Once you have an idea of what types of assets you want to include in your portfolio, it’s time to decide how much.
You can always change how much you have allocated to a particular asset class, of course. But, why get off on the wrong foot? Your best bet is to run it through a model.
4) A note about volatility
Everyone thinks that volatility equals risk. I think that volatility equals volatility. Risk has to do with your chances of going bust.
But, between now and the time you close the position, your investments could behave in less-than-ideal ways. You need to decide if you can tolerate that behavior or not.
5) Asset classes and sub-asset classes
Keep in mind that nearly every broad asset class can be niched down.
Stocks can be invested in dividend-paying stocks, growth stocks, value stocks, technology stocks, and so-called bellwether stocks.
Bonds can be broken down into government bonds, corporate bonds, high-yield bonds, and risk-free bonds.
Mutual funds can be stock funds, bond funds, index funds, growth funds, or specialty funds.
You get the point. The same goes for ETFs, Forex, futures, crypto, whatever.
Each sub-asset class might behave differently. So, be wary of using proxies or grouping (sub) asset classes together when using the downloadable workbook. The point is to get a somewhat accurate representation of how these assets will behave in concert.
Rebalancing your portfolio as needed
Rebalancing means reviewing your investments to ensure that they are still helping you toward your goals. Volatile portfolios should be reviewed more often (6-12 months) than less volatile (2-3 years). A spreadsheet or other software tool can help you rebalance effectively.
After you run through the workbook and get a feel for how you want to allocate assets, you can always come back and reevaluate.
Different circumstances are going to call for the creation of different investment portfolios. If you’re young/carefree and have a little bit of extra money that you want to invest, you might take a riskier approach. Maybe you don’t care if you lose this relatively insignificant amount of money? However, you do love the idea of being able to turn it into a small fortune.
On the other hand, if you’re looking at how to allocate a sizable sum that represents your entire net worth, you might not have the same stomach for risk. You might want to minimize the odds that you end up with any sort of loss. In order to minimize those odds, you’re willingly sacrificing some of your potential gains.
Anyhow, if you find yourself with FOMO or sleepless nights, then it’s probably time to reevaluate your investment portfolio rebalancing.
Keep in mind however that selling certain assets and buying others might result in unfavorable taxes or other penalties.
Download this workbook to create an investment portfolio you can believe in!
Complete the form below and click Submit.
A link to the Google Sheet will be emailed to you.
Once you’re in the spreadsheet, click on File > Make a copy to edit. I’ll no longer be responding to “Requests for access.”
If you’ve been to this site before, you know that I love creating models.
With this investment portfolio worksheet, you can toy with investment amounts, margin, and volatility. Just drop in the price history for the said asset. If that’s not available, use the history for one that you think will act in a similar manner.
How to use the investment portfolio workbook
First, on the Variable & Values worksheet, enter the name/ticker for each Asset along with the Initial investment. You can enter % Owned (margin) and Extra volatility percentages now if you like. Or you can enter them later.

% Owned (margin) is the amount of equity you have in a position. For instance, if you buy a stock on margin, you’ll likely have 50% equity. The other 50% will be borrowed. If you’re using something as a proxy, like I did with GRU (commodities), you can also simulate the effects of high leverage by entering a low % Owned (margin) percentage.
The Extra volatility variable allows you to see what would happen if daily price changes were more drastic. For a given Asset, each will move up or down by the increased percentage you enter here. E.g. if you enter 10%, a $1 daily price movement will be increased to $1.10.
Next, go to the Close History worksheet and enter (copy + paste from Yahoo! Finance) for each asset.
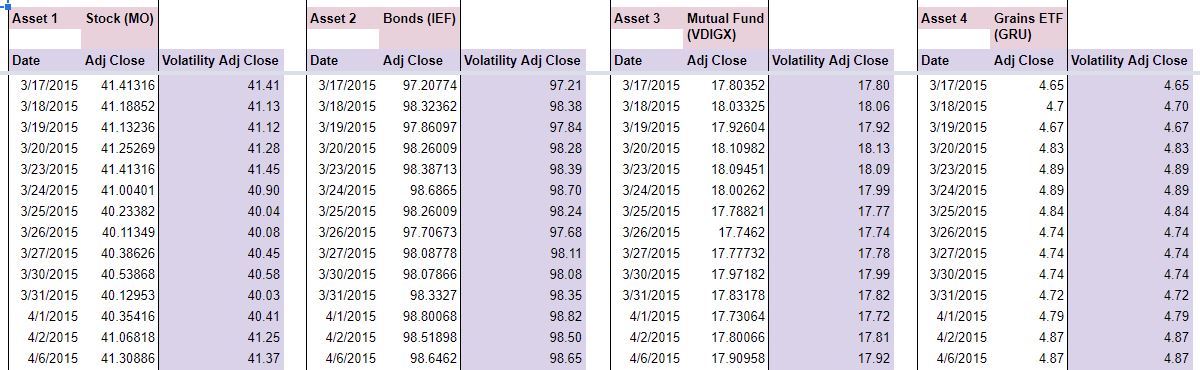
Try to make sure the Dates match for each row.
If you have the skills, you can use the GOOGLEFINANCE function to populate Dates and prices using the tickers you enter on the Variables & Values worksheets. I didn’t do so in my example because I wanted to use the Adjusted Close prices from Yahoo! Finance. They include dividends and I thought that was important to the analysis.
Interpreting the output
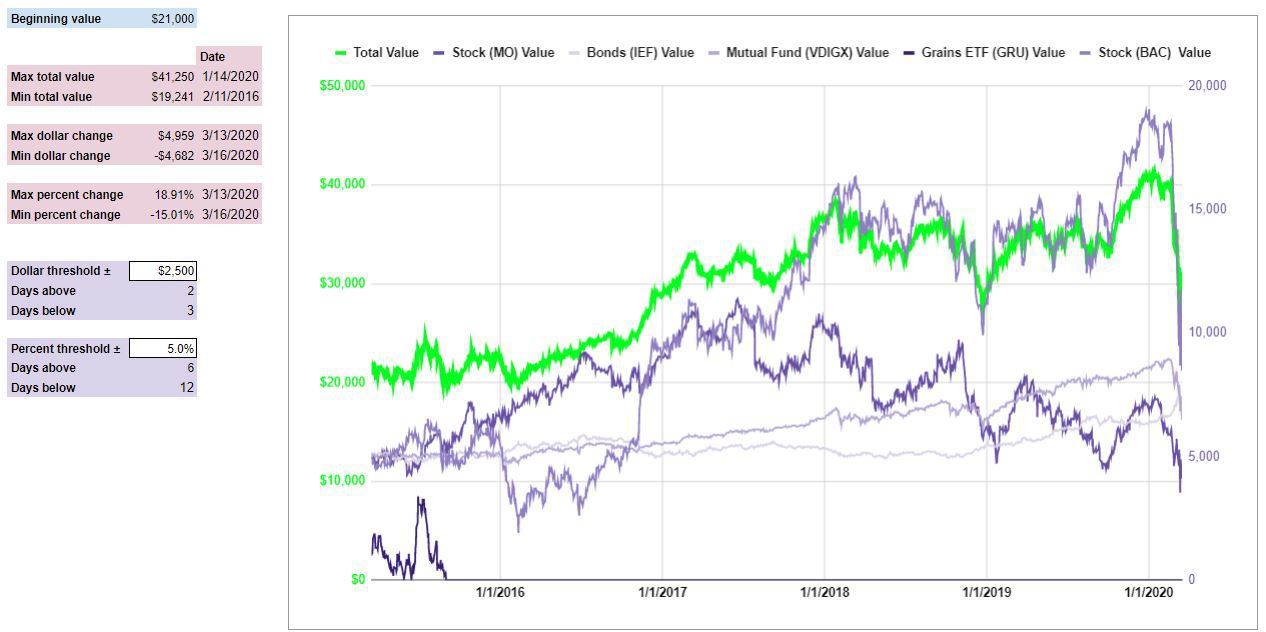
On the Summary worksheet, you’ll see the results of what you entered.
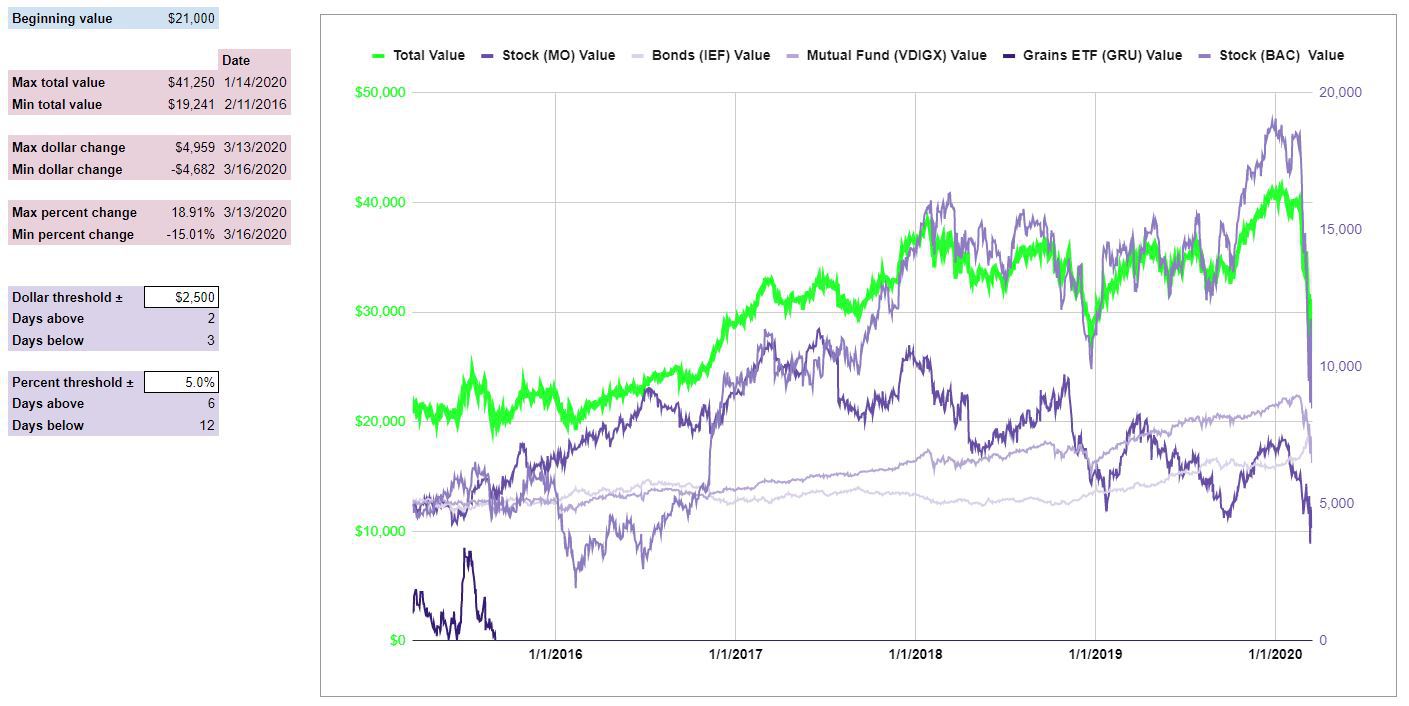
Compare your Beginning value to the Max/Min total values.
Also, decide if you’re comfortable with the Max/Min dollar & percent changes. Can you sleep at night knowing that your portfolio could increase or decrease by these amounts? If not, you had better revisit your margin percentages or consider changing the assets in your portfolio.
Finally, if the dollar & percent change data have piqued your interest, then you can enter a custom Dollar & Percent threshold to see how many days your portfolio met or exceeded those amounts.
Some limitations of the workbook
At this time, the workbook does have some limitations, unfortunately. At some point in the future, I may make modifications to address these issues.
The first, and most obvious is that there is only room for five different assets. If you’re good with spreadsheets, you can probably figure out how to add more.
This isn’t a tool to come up with an optimum decision. Or an exact forecast.
Rather, one that generalizes the volatility you might expect to see based on your asset allocation and use of leverage. So, assets can be substituted and proxies can be used, as needed. The ultimate goal is to mentally prepare you for the swings in value you might see based on the variables you choose.
Speaking of asset allocation, one type of asset not available for analysis is shorts and/or puts. The formulas are only set up to measure gains from price increases, not decreases. At some point in the future, if the demand is there, I might add that functionality.
Creating an investment portfolio that’s right for you
- Understand your goals
- Choose an appropriate timeline
- Decide what types of investments you want to own
- Be mindful of the costs
- Pick investments within those categories
- Review your portfolio as needed
With this simplistic workbook, hopefully, you can decide how diversified you should or shouldn’t be. No other investment guru knows what exactly right for you.
Keep in mind that if you create a scenario that’s very volatile, there’s a good chance that reality will mimic what you modeled. Perhaps even amplify it.
So, when things get choppy, look back at your workbook and remind yourself that you anticipated scenarios like this. Remind yourself that, in the end, you’ll probably still meet your goals.
I hope this workbook helps you weather the storm with more confidence.
Analyzing your investment portfolio | are you satisfied?
- Types of investment portfolios
- Bold, aggressive
- Seeks big gains, tolerates big volatility
- Hands-off, passive
- Seeks modest gains, tolerates little volatility
- Conservative, defensive
- Seeks to protect downside
- Dividend, interest, income
- Seeks to provide cash flow
- Speculative, risky
- Seeks make-or-break gains
- Retirement, nest egg
- Seeks to free you from employment
- Sentimental, personal
- Seeks investments that mean a lot to you
- Value, underpriced
- Seeks investments that sell for less than their worth
- Diversified, mixed
- Seeks a wide variety of investments
- Copycat, mimic
- Seeks to replicate someone else’s portfolio
- Managed, administered
- Portfolio considerations/allocations made by someone else
- Bold, aggressive
There’s more to consider when analyzing your investment portfolio than just returns. Is it too volatile for your taste? Have your goals changed? What about the individual assets that make up your portfolio, are they pulling their weight? Your portfolio should be working for you, so make sure it’s doing its job!
What is investment portfolio analysis?
After using the investment portfolio spreadsheet – is your portfolio performing the way you expected? It’s likely that you have some investments that are performing better, and some doing worse. But as a whole, if your portfolio isn’t performing as you anticipated, it’s time to reevaluate.
Oftentimes, portfolio performance is judged against an index, like the S&P 500. That may or may not be appropriate for you. Depending on your investment allocation, you may willfully be sacrificing some return for peace of mind. On the other hand, the S&P 500 return may be the floor rate that you would find acceptable.
Perhaps you made a mistake in including, or excluding, a particular investment in your portfolio. Or, it’s possible that some assets, due to their performance, have become over/underweighted in your portfolio. This disproportionate weighting has caused the returns of those assets to dictate the return of the portfolio as a whole.
The key is to think back to what your expectations were when you built your investment portfolio. How are the individual asset (classes) performing relative to those expectations? Are they more or less volatile than you planned? How much is leverage amplifying that volatility?
How often should you perform an investment portfolio analysis?
Once a year is the rule of thumb. That should ensure that things don’t get too far out of whack before you have a chance to wrap your arms around it. But, you can also do it if you have a major life event taking place. For example, marriage, having children, kids going to college, purchasing a business, retirement, etc.
Is each asset in your portfolio pulling its weight?
You know that past performance doesn’t dictate future results. But, when you were deciding how you wanted to allocate your portfolio you hopefully got an idea of how each asset would perform. In the future, you can refer back to the investment portfolio spreadsheet and use it as your blueprint. Then, you can compare each investment to this blueprint and decide if it’s performing as you would expect.
There are three things to keep in mind when you’re building a portfolio:
- Your tolerance for volatility
- Your investment time horizon
- Your expectation for return
Based on those three factors, you decided how much to invest in each asset.
Compare each asset, as it stands with your expectations when you first purchased it. Is it more volatile? How’s your time horizon changed, if at all? Is the return what you expected it to be? If reality has not matched your expectations, it’s time to start analyzing why.
With new expectations, you can re-enter information into the spreadsheet. Make sure you’re comfortable with the Summary data. If not, then change the amount allocated to each asset. Or, substitute a different asset(s).
Different asset classes perform differently
Ideally, you will have an asset mix in your portfolio that protects you against catastrophe, while not stifling your gains too much.
If you find that’s not the case, then it’s time to go looking for new assets. Was an asset that performed not-as-expected, due to the performance of the entire asset class? Meaning, did every asset of that type perform that way (even the ones you didn’t own)?
Or, was this asset rogue, performing poorly while others did well? Alternatively, did it perform abnormally well, while others did poorly? Though it might seem counterintuitive to get out of a winning position – if it doesn’t meet your allocation goals, then it’s something you should consider.
Also, think about the future. Was the performance of your assets a one-time thing? An anomaly? Or, is it indicative of how they’ll act in the future?
Don’t forget about dividend and interest income
The investment portfolio spreadsheet can factor in the effect on returns due to dividends. However, it doesn’t really factor in the implications of dividend and interest income.
If you count on this income then, obviously, that’s important. It will be a huge deciding factor in your asset allocation.
This is particularly true given the fact that interest rates are currently near zero. Old-school, go-to investments for fixed income might not cut anymore. CDs, money market accounts, even bonds or bond funds might not provide adequate income.
Therefore, if you need income, necessity might dictate that you subject yourself to greater volatility. So, while the spreadsheet might not account for income, per se, it can help you gauge your appetite for volatility. If you find an investment that you think will pay a satisfactory income, you can plug its history into the spreadsheet and see how much you might expect it to change in value over time. You can even amp up the volatility, if you like, to be sure you’re comfortable for whatever that asset might throw at you.
By analyzing what you want (and what you think you might get), you can set the groundwork for an investment portfolio that really meets your needs. This is preferable, of course, to guessing or making changes based on emotion. Remember to periodically revisit your plan and tweak it as needed.
Investing in companies you believe in | better than indexing?
Investments in companies you believe in (“admired” companies) don’t always outperform the S&P. But, they usually don’t lose money either. At least in the years examined – 2004, 2010, and 2016. Referring to the Most Admired Companies list might be a good starting point if you’re looking for stock investing ideas. Find the most admired companies on the Fortune website.
Maybe you have no idea what to invest in. If so, that’s okay. There are a lot of alternatives out there and (particularly new) investors can suffer from the “paradox of choice.”
One place to start, as far as stocks are concerned, is with what you’re familiar with. Analyze and (if appropriate) invest in companies you like. The fact that you like these companies will help keep you interested in their business dealings and performance as time goes on.
In these examples, investments were chosen, at random, from past years’ Most Admired Companies list. Since I don’t know what companies you like, specifically, I had to take a guess.
Their performance was then compared (dividends included) to the performance of the SPDR S&P 500 ETF Trust (SPY). The goal was to see if investing in companies that people believed in was a good strategy.
Is it enough to just “like” a stock?
Probably not.
Though, if you like a company, and others do too, then I would interpret that as a positive sign.
It probably means that you are a customer of theirs. A company that people believe in should see consistent revenue, and possibly growing revenue, through customer recommendations. Revenue growth is critical for profit growth. Profit growth is key for stock price appreciation and dividends.
People (if possible) stop doing business with company’s they hate. So, by being admired, a company might worry less about customers leaving. Plus, it can avoid the expense and effort required to replace them.
Also, a positive reputation can only help their stock price. All other things being equal.
But…
The case against investing in companies you believe in
An income statement doesn’t measure reputation. It measures profit. It’s a reflection of the amount of revenue they earned and the costs incurred to make those sales.
At some point, we would assume, that there needs to some “substance” to back up a bolstered stock price.
Consider the dot-com bubble. A lot of those organizations were well regarded for their potential. But, at a certain point, the exuberance of investing in them outpaced the actual dollars and cents. At that point, valuations could no longer be supported.
How will the companies you believe in perform?
Well, that’s a tough question to answer since I don’t know what you like.
But, I tried to make the best example I could. If your stock isn’t addressed in the examples, you can pretty easily duplicate what I’ve done here.
My examples looked at some of Fortune’s Most Admired Companies over the years. Their performance, including dividends, was compared to the SPDR S&P 500 ETF Trust (SPY) – an S&P 500 index fund.
Dividends play an important part in returns. Especially over a number of years. So, it was important to include them.
Details of the example
- Some of the Most Admired Companies from 2004, 2010, and 2016, were analyzed
- FYI, this post was written in late 2019
- Investments were chosen at random with higher-rated companies given more weight
- The assumption being that higher-rated companies are more broadly liked
- Annualized Returns were compared to SPY for 15, 9, and 3, years respectively
- Based on adjusted returns (returns including dividends)
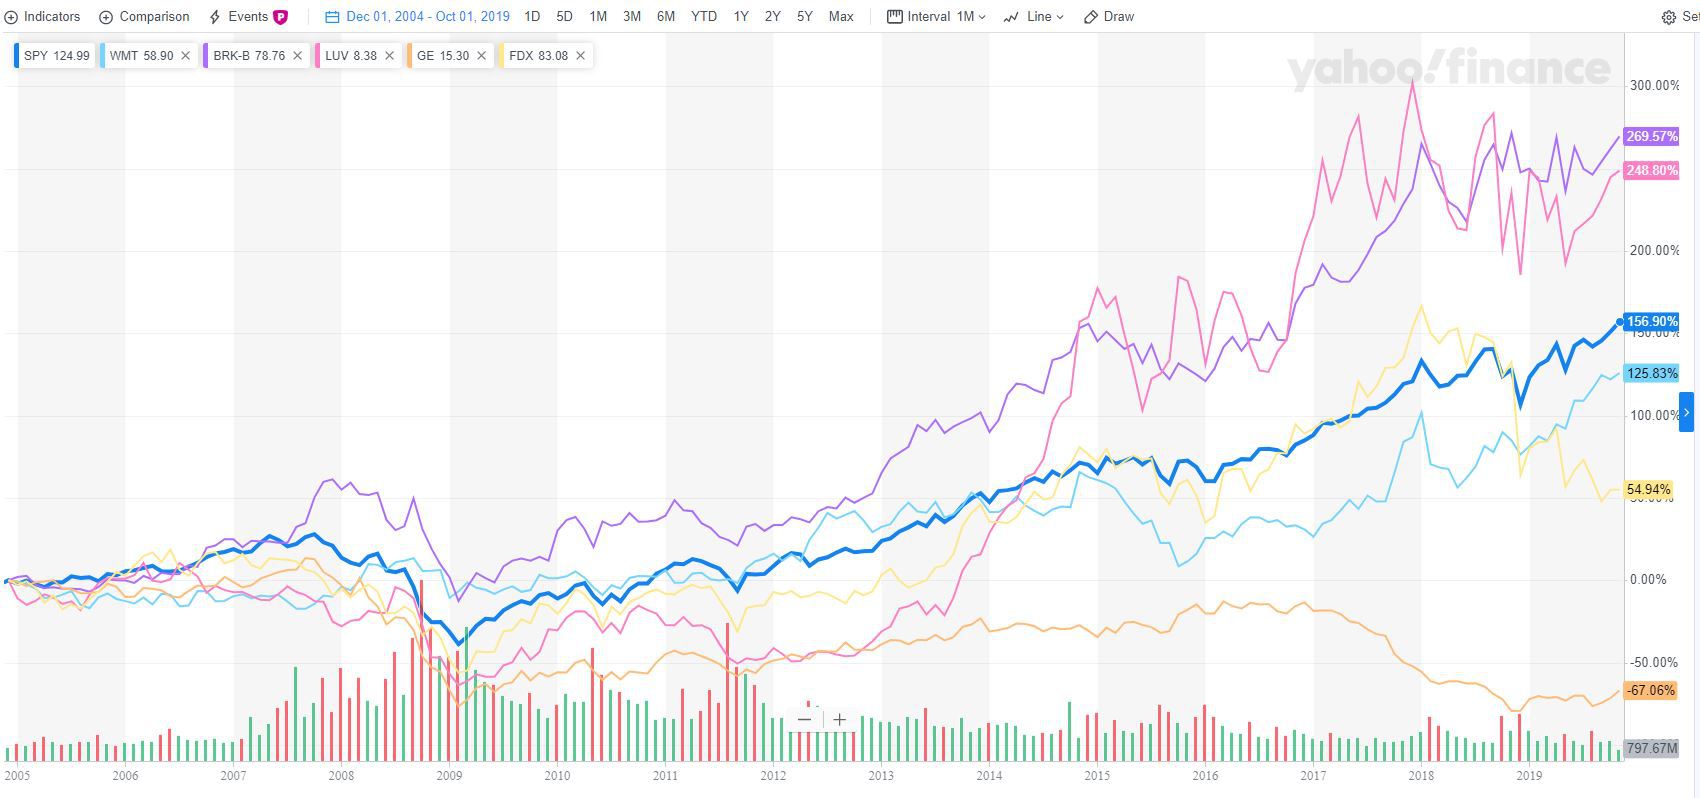
- Performance over the period was also charted
- Dividends were not factored into the chart
The results of the examples
What conclusions can be made from a sampling of the Most Admired Companies?
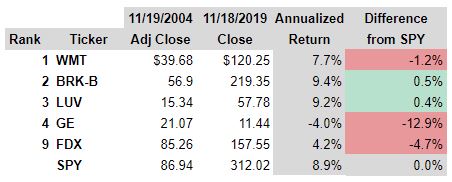
Most Admired Companies 2004
This list only contained 10 companies (Source). The ones analyzed were:
Walmart Inc. (WMT)
Berkshire Hathaway Inc. (BRK-B)
Southwest Airlines Co. (LUV)
General Electric Company (GE)
FedEx Corporation (FDX)
Here’s a look at the returns:
Click to enlarge
Results here were poor. The stocks that outperformed SPY only did so by a fraction of a percent per year. I guess that can add up over 15 years or so, though.
The chart makes it look like BRK-B and LUV trounced SPY. From a price appreciation standpoint, they did. But, SPY seems to have paid a higher dividend yield than LUV over the past 15 years. BRK-B, famously, has never paid a dividend and probably never will.
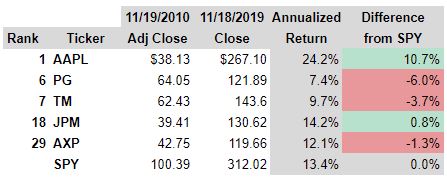
Most Admired Companies 2010
At this point, the list had been increased to 50 companies (Source). These were the ones analyzed:
Apple Inc. (AAPL)
Procter & Gamble Co (PG)
Toyota Motor Corp (TM)
JPMorgan Chase & Co. (JPM)
American Express Company (AXP)

Click to enlarge
Again, only two stocks beat SPY on an annualized basis. One of them, AAPL, did so handily. Not only did AAPL’s price appreciation trump SPY, but AAPL also started paying a dividend in 2012. This helped to boost returns.
I would have expected JPM to beat SPY by more – given the difference in price appreciation and their (currently) healthy dividend yield.
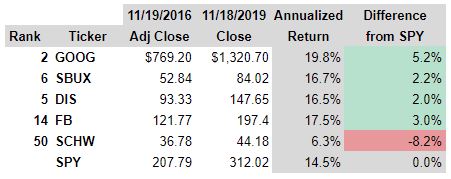
Most Admired Companies 2016
Jumping ahead another six years (Source). Here’s who was analyzed:
Alphabet Inc. (GOOG)
Starbucks Corporation (SBUX)
The Walt Disney Company (DIS)
Facebook, Inc. (FB)
The Charles Schwab Corporation (SCHW)
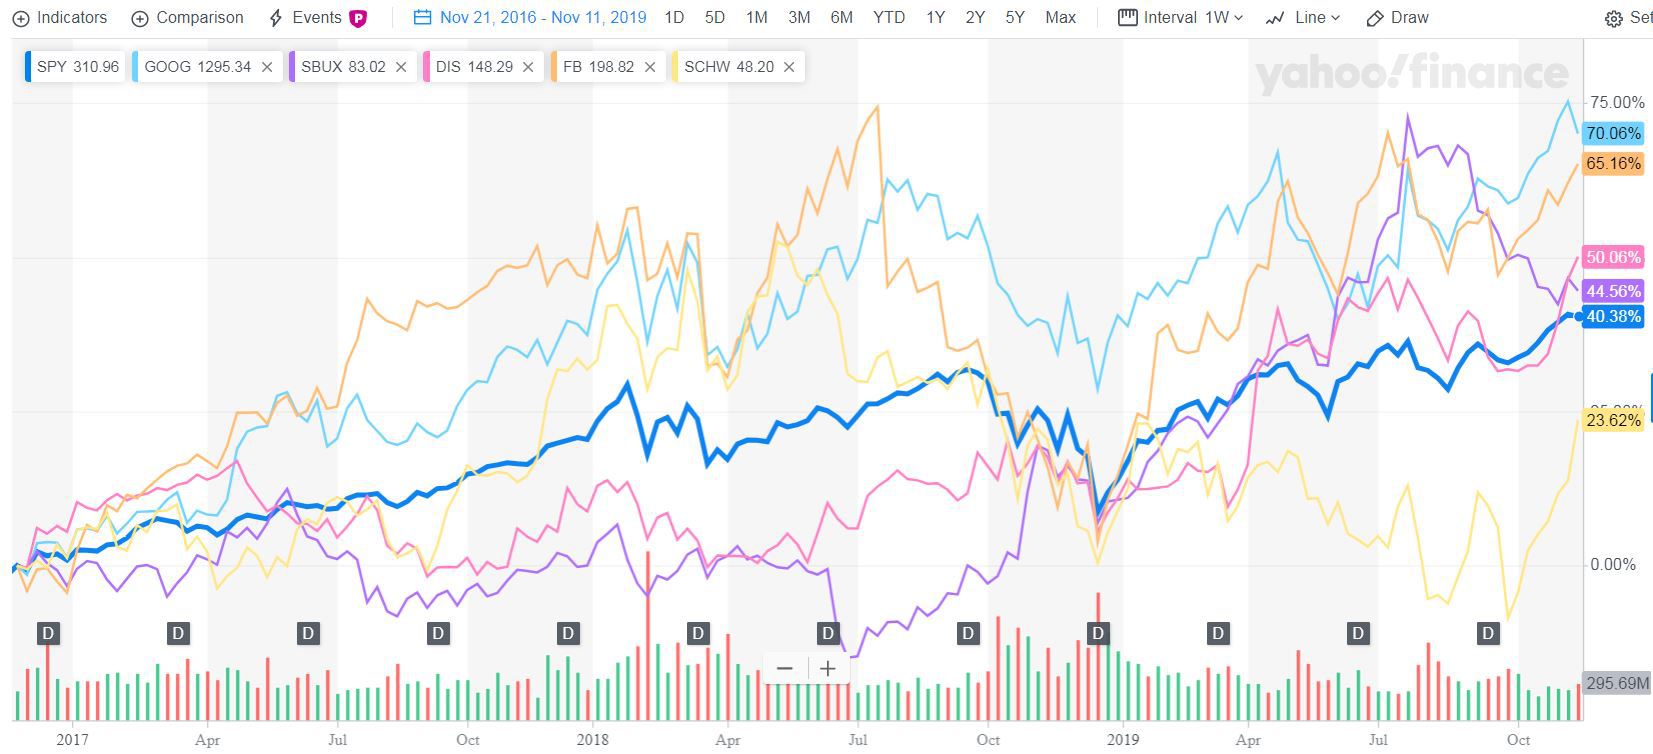
Click to enlarge
Now we’re talking! Even though the SPY had very healthy returns during this period – the analyzed stocks did considerably better. The only exception being SCHW, of course.
Two of the four stocks have never paid a dividend, either (GOOG & FB).
Preliminary conclusions from investing in companies you believe in
Obviously, this is just a small sampling of all the Most Admired Companies. So, I would caution you not to jump to any conclusions.
Some things did stand out to me, however.
First, the more recent the list, the better the stocks on it seemed to perform. Though, if you look at the charts, you’ll notice that some of the investments underperformed the SPY before they outperformed it. More on that later.
Second, dividends matter. Again, this can be seen in the charts. Some stocks trounced the SPY in terms of price appreciation. But, when you looked at the adjusted returns, including dividends, they didn’t outperform nearly as well. Conventional wisdom says that a business will not pay a dividend if it can reinvest those funds more profitably in itself. This bit of anecdotal evidence doesn’t really back that up, however.
Finally, almost all Annualized Returns were positive. Nearly every Most Admired Company examined was a profitable investment over the long term. The only exception was GE. GE’s lost nearly half its value over the past 15 years.
What else to consider when investing in companies you believe in
Keep in mind that the timelines for these models are essentially random. When I was planning this post, I knew that I wanted to look 15, 9, and 3 years into the past. However, it’s just happenstance that I chose to start this post in mid-November.
Had these stocks been purchased earlier or later than November of the given year, the results might have been quite different.
Consider this – if you examine the same group of investments from the Most Admired list starting in August of 2016, you get considerably different results. At least from a price appreciation standpoint:
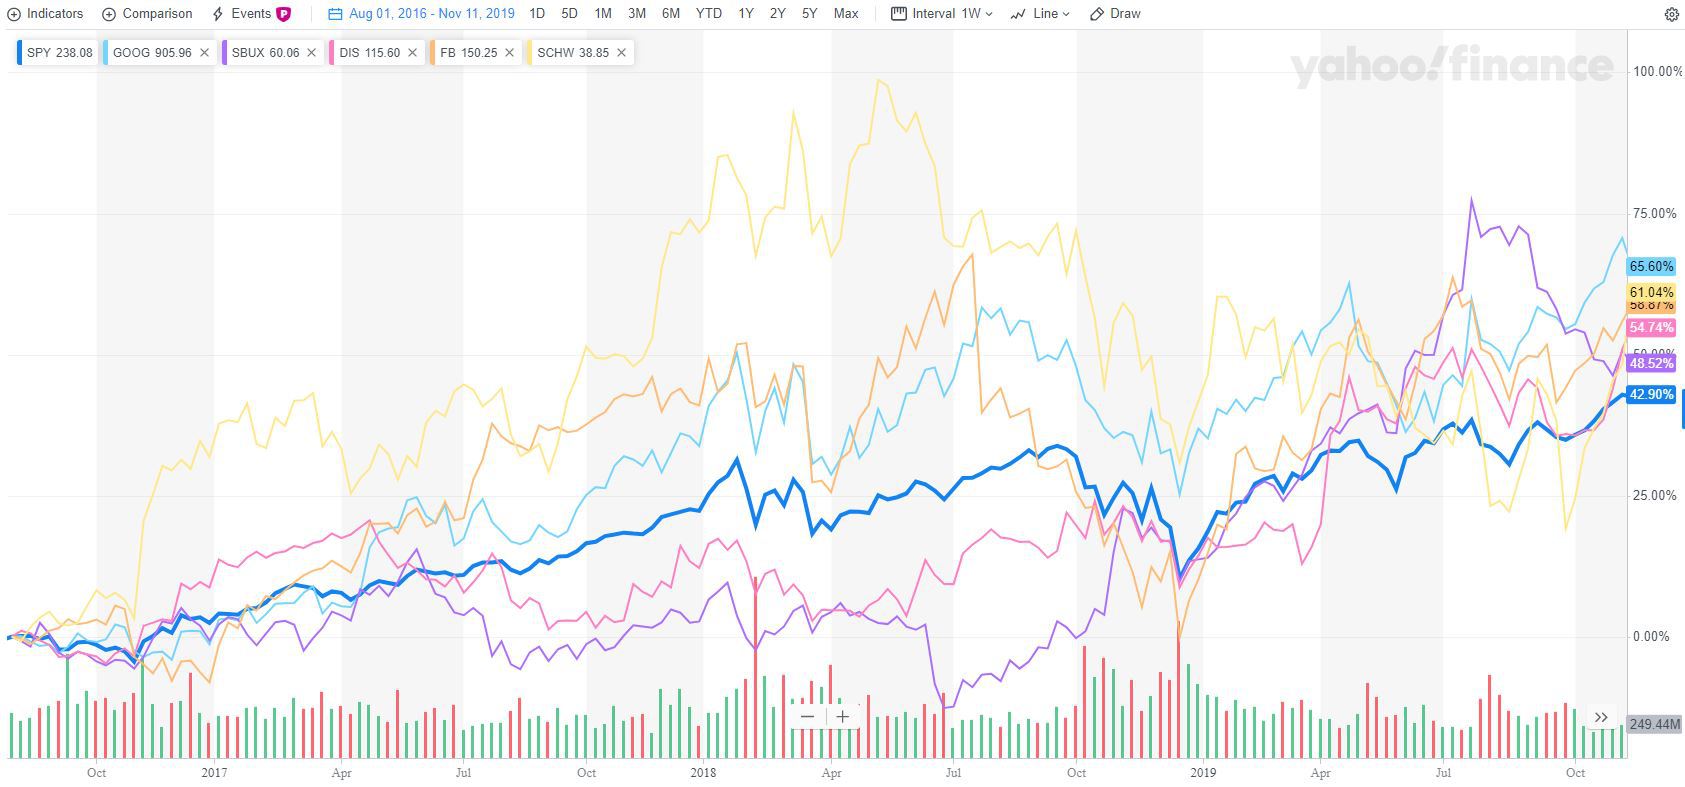
Click to enlarge
Buying SCHW almost four months earlier would have outperformed SPY and every other stock in the group except GOOG. This is because SCHW took a big jump in early November 2016. By the time our previous model started – you would have missed out.
Dollar-cost averaging into SPY and the Most Admired companies might have yielded drastically different results. That’s something I’d like to explore more in the future.
At the end of the day, you’re participating in a popularity contest if you’re investing in stocks you admire without doing any due diligence. I do think it’s a good place to start exploring, however.
If you’d like to be a little more sure of your investment, check out my post on creating a stock analysis spreadsheet. It’ll walk you through how to analyze the fundamentals of a stock. You can also download the spreadsheet template I use in that post.
If you like a stock and have analyzed it thoroughly, you should hopefully feel comfortable making that investment. If not, you should probably stick to mutual funds.
What are the disadvantages of portfolio management?
Thinking about your goals and how your portfolio can help you achieve them is generally time well-spent. There are some pitfalls to look out for, however.
If the volatility of your portfolio spooks you and compels you to over diversity, you could miss out on big gains. Which, in turn, could delay or cause you to miss your goals. Keep in mind that past volatility is not necessarily indicative of future volatility. Sure, volatility could be worse. But…it also might not be as bad as you think.
Also, even once you’re comfortable with your expected returns, volatility, and time horizon – that doesn’t mean that your downside is protected. Things could still go sideways. You’ll want to think about risk management.
Finally, be aware of the potential for your own bias when constructing your portfolio. Don’t assume that the future will be exactly like the past and don’t expect to be 100% right in your predictions/expectations.
Contents
- Building an investment portfolio | what to consider?
- What asset allocation works for you?
- Rebalancing your portfolio as needed
- Download this workbook to create an investment portfolio you can believe in!
- Creating an investment portfolio that’s right for you
- Analyzing your investment portfolio | are you satisfied?
- Investing in companies you believe in | better than indexing?
- What are the disadvantages of portfolio management?