Updated 05/01/2021
Feedback? Let me know on Twitter.
Information is pulled from numerous sources; including but not limited to Bankrate.com, Morningstar.com, and GOOGLEFINANCE (in Google Sheets). No guarantee of accuracy is made.
Where to invest money to get good returns?
| Inflation | 2.40% |
| Inflation Override | 4.80% |
| Investment Type | Median Return | Return Override | Median Max Pct. Gain | Median Max Pct. Loss | Median Days > 1% Gain | Median Days > 1% Loss | Amt Needed to Earn $1K/mo. | Purchasing Power of $1K in 1 Year |
|---|---|---|---|---|---|---|---|---|
| High-yield savings account | 0.55% | $2,181,818 | $957.50 | |||||
| CDs | 0.48% | $2,500,000 | $956.80 | |||||
| ST gov’t bond ETFs | 0.11% | 1.95% | 0.16% | -0.20% | 0.00 | 0.00 | $615,385 | $971.50 |
| ST corporate bond ETFs | 6.04% | 3.12% | 0.85% | -0.53% | 0.00 | 0.00 | $384,615 | $983.20 |
| Muni bond ETFs | 7.09% | 2.91% | 1.14% | -0.70% | 1.00 | 0.00 | $412,371 | $981.10 |
| TIPS ETFs | 7.15% | 6.73% | 1.45% | -1.22% | 1.50 | 1.00 | $178,306 | $1,019.30 |
Inflation, as of the time of this writing, was coming in at 2.4%. Of course, the impact of inflation depends on what you’re spending your money on.
I’m in the camp that feels that inflation will be higher in the short to mid-term than it’s been for quite some time. I base my opinion on the fact that so much new money has been created over the past year. And, as far as I know, output has not kept pace. It’s something that I want to do a little more research on. So, my opinion could change in the future. But, that’s where I stand as of now.
Therefore, for this analysis, I overrode the inflation rate and doubled it – 4.8%.
As specified below, median returns for Bond ETFs were based on the price appreciation and 12-month yield, net of adjusted expenses. In future updates, I might refer to the 30-day SEC yield. But this is what I’m working with for now.
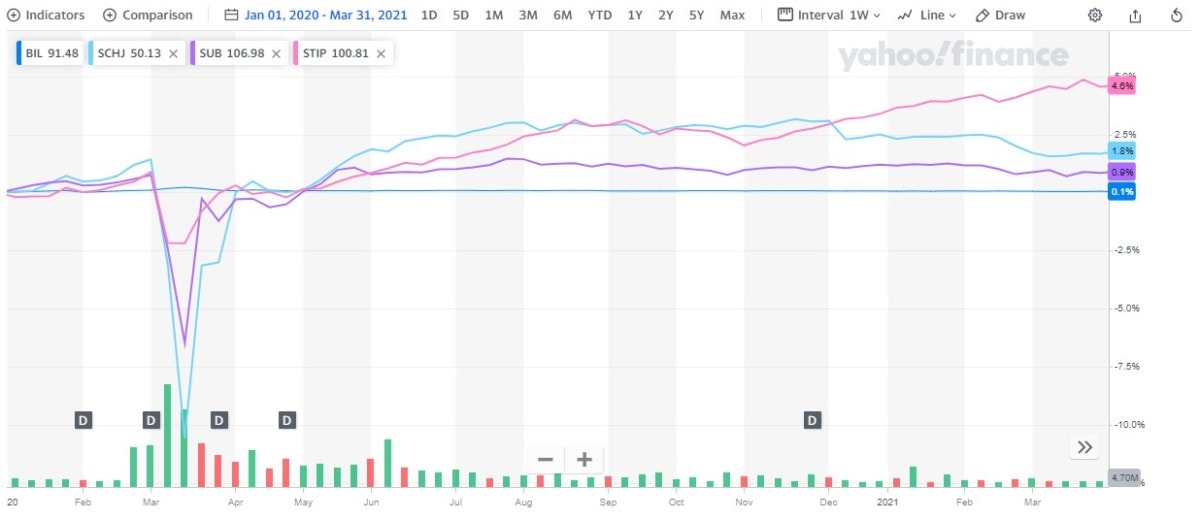
The period referred to for price appreciation was April 1st, 2020 through March 31st of 2021. Obviously, this was an odd time in human history. As of April 1st, 2020, prices for exchange-traded assets we’re still rebounding off of their lows reached in the infancy of the covid-19 pandemic.
Therefore, to get an idea of what these assets would have returned, under normal circumstances, I re-ran my analysis for the period of January 1st, 2020 through March 31st, 2020. Though this period of time was 15 months, I calculated the CAGR to keep the analysis focused on a one-year investment period.
These returns, for the bond ETFs, are entered into the Return Override field. As you can see, this resulted in a few significant changes.
The TIPS ETFs provided, by far, the best returns of all the assets analyzed. In fact, TIPS ETFs appeared to be the only short-term investment providing a good enough return to beat inflation.
Those returns, however, come with increased volatility. The Max Pct Gain & Loss, more or less, performed as expected. The short-term investments with the highest returns are the ones with the most drastic daily gains and daily losses.
On the same token, short-term Investments with higher returns also tended to see more days of greater than 1% gains and losses.
Why analyze short-term investments?
This ongoing analysis was created to compare short-term investment options in terms of safety, risk, and return.
Not every investment has a timeline of 10+ years. Sometimes people are looking for a place to hold their money in the short term. A place where they can earn enough of a return to maintain purchasing power but not take on too much risk.
I hope that by collecting this information and laying it out to allow for easy comparison, people can make an educated decision about where to invest in the short term.
What short-term investments were analyzed?
- High-yield savings accounts
- CDs
- Short term government bond ETFs
- Short-term corporate bond ETFs
- Municipal bond ETFs
- Tips ETFs
ETFs were referenced instead of regular mutual funds, simply because information on ETFs is easier to retrieve.
How are these short-term investments analyzed?
The first variable addressed is inflation. Inflation erodes the value of your short-term investments. Therefore, returns must outpace inflation if you hope to make a worthwhile short-term investment. The inflation rate is pulled from this source. The inflation rate on my spreadsheet can be overridden if deemed necessary.
The Inflation (Override) percentage will affect the Purchasing Power of $1K in 1 Year calculation.
Investment returns | The reason to invest money
Ten samples are referenced for each type of short-term investment. The Median percentage Return for all of the samples is used to compare short-term investments. Like inflation, this percentage can also be overridden.
Median is used instead of average to eliminate the effects of disproportionately high or low returns. Outlier returns can be particularly prevalent with ETFs. Less so with high-yield savings accounts and CDs.
Speaking of high-yield savings accounts and CDs, the APY is pulled from bankrate.com. A variety of different terms are used for CDs.
As for ETFs – dividends and any returns from price appreciation/depreciation are taken into consideration. Offsetting those returns is the expense ratio for each ETF. Price appreciation + dividend returns – expenses results in a net return. Which is what is referenced in this analysis.
Investment safety | Preserving your money
Safety is a tricky thing to analyze. As far as I know, none of these investments have any material likelihood of losing all their value.
Safety can be measured with alpha, beta, the Sharpe ratio, and other similar means. But, I didn’t think those were appropriate for these short-term, low-risk investments.
So, what to use then?
I ultimately decided to focus on volatility. I’ve covered volatility in a portfolio context previously. Volatility was analyzed via two perspectives. The first is severity. The second is frequency.
The severity of volatility is captured by looking at the maximum daily percentage change in price for each ETF. This includes price increases and decreases.
The frequency of volatility is measured by counting the number of days that a percentage change greater than 1% occurs. That also includes price increases and decreases.
In the future, I’ll likely lower this 1% threshold (to perhaps .5%?) for a more meaningful analysis.
What other metrics were used to measure good returns?
For each short-term investment, the amount needed to earn $1,000 per month is also calculated. This amount is based on the median return for each investment, or Override amount if entered.
Additionally, the purchasing power of $1,000 in one year is also calculated. This field shows the net effect of the return of the short-term investment and the effect Inflation (Override) would have on those returns. If this amount is less than $1,000, then you might expect your purchasing power to decrease (based on the assumptions made, anyhow).
Finally, conditional formatting is used on the return and safety fields to help you better visualize the distinctions between each short-term investment. Sparklines are used for the same purpose below the table too.
What short-term investments were left out?
I have previously written about places to invest money short-term for good returns. Most of those were included in this analysis, with a few notable exceptions.
Regular savings accounts and checking accounts are not included in this analysis. Either online or at your local bank, it was assumed that regular savings accounts would not have as good of returns as high-yield savings accounts.
Money market ETFs were also not included. Simply because I could not find enough of them to compare with the other investments. They may be included in the future.
P2P Lending was also excluded. Unfortunately, information regarding P2P investments was difficult to find. The only remotely practical source I could find was prosper.com. One problem with referencing Prosper was that I couldn’t make an account due to my location. Another, bigger problem, was that Prosper only appears to have three and five-year term loans. So, those would not fit with the theme of this analysis which is short-term (less than 1 year) investments.
Kiva was another P2P site that I found. However, their loans are for charity and therefore do not collect interest. While that may be fine and good, it, again, doesn’t fit with the theme of this analysis.
Short-term investment questions & answers
There’s nothing exotic about the investments analyzed in this report. However, perhaps there are some particulars that you’re unsure of. I’ll try to address some of those here. Maybe I’ll even have answers to some questions you never thought to ask.
More questions made be added as this post is updated.
High-yield savings accounts
Can you lose money in a high-yield savings account?
No. Not if the high-yield savings account is with an FDIC or NCUA insured financial institution. Source. I would suggest that you ensure if they are before you open a high-yield savings account.
How much does the FDIC insure?
The FDIC will insure up to $250,000 in deposits per account holder, per bank. Souce.
How much does the NCUA insure?
The NCUA will insure up to $250,000 per account holder, per credit union. Souce.
What is the downside of a high-yield savings account?
- Interest rates vary so the APY you earn this month might be different from the APY you earn 6 months from now.
- The APY may not (and currently isn’t) outpacing inflation. This means that an investment in high-yield savings accounts could lose money.
- Many high-yield savings accounts are with online banks. This means that transferring funds to a more accessible account might take up to 48 hours.
CDs
How do you calculate APY?
APY is different than the generic term “interest rate.” It allows for comparison between investments. APY is the real rate of return that would be earned over a year’s time if that particular investment were allowed to compound.
APY is calculated as follows:
(1 + (interest rate ÷ number of compounding periods))number of compounding periods) – 1
Therefore, if you’re comparing two investments, the one that has the greater number of compounding periods in a year will provide the greater return. All things being equal. Source.
Check out this post to learn more about compounding.
Bond ETFs
Do bond ETFs pay dividends or interest?
Fixed-income ETFs, (such as federal government, municipal, and corporate bond ETFs) make interest distributions, not dividends. Source.
Interest distributions are typically made monthly. Capital gains distributions, if applicable, are typically made yearly. Souce.
Are bond ETFs good for inflation?
Bond funds tend to lose value when inflation is high. This is because interest rates often rise with inflation. When interest rates rise, bonds with lower rates typically lose value. Souce.
TIPS ETFs are the only bond funds that are likely to offer protection from inflation. Where else can you invest money to get good returns in an inflationary environment? Consider commodity funds, real estate funds, and gold funds. Source.
What is the difference between SEC yield and 12-month yield?
The SEC yield uses a standardized formula that allows for comparison between bond funds. It is an estimation of the yield that you can expect over the next 12 months based on what’s been paid out over the past 30 days. The SEC yield is also net of fees. While the 12-month yield is not. Source.
The 12-month, or distribution yield, as it is sometimes called, can be skewed by special dividend payments or capital gains. Souce.
As of this writing, the 12-month yield was used to calculate returns for bond funds (after the adjusted expense ratio was subtracted). This may change in the future.


