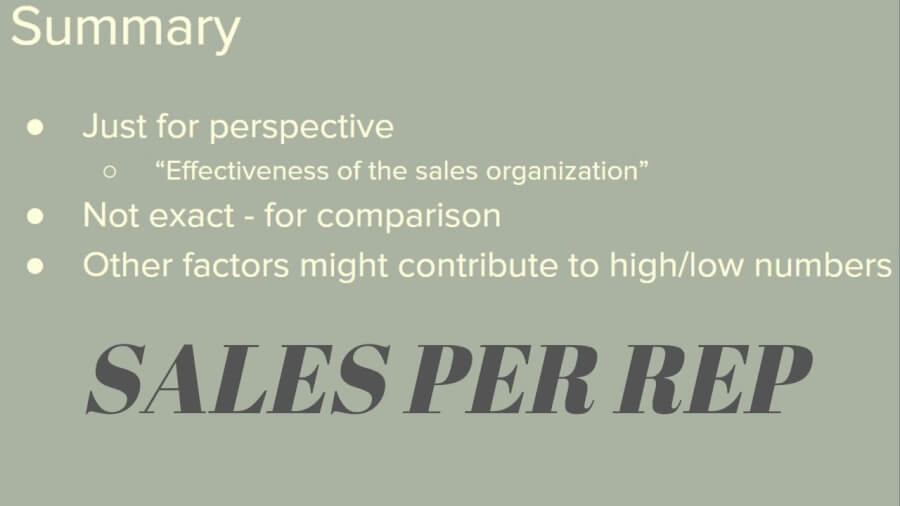
Average Revenue per Sales Rep Video Summary
This analysis is just for perspective. It rounds out the rest of the “Effectiveness of the sales organization” posts.
This is not an exact analysis. Merely a way to compare stocks.
Other factors might contribute to high or low Sales per Rep numbers. User experience or the company’s business model, for example.
Revenue/Sales
The numerator.
Start with Trailing Twelve Months (TTM) of revenue. This might be more up-to-date than revenue for the previous fiscal year. This information can be found on finance websites or in SEC filings.
I prefer the actual revenue amount rather than abbreviated (in millions). For example $66,529,000,000 vs $66,529 (millions). The full revenue amount will give you an actual sales per rep figure. It’s merely a matter of preference, however.
Marketing & sales employees
The denominator.
Marketing and sales employees are the “reps.” Marketing employees could be considered indirect sales reps. Sales employees could be considered direct sales reps.
The only way I know of to approximate the number of employees is via LinkedIn. It’s certainly not exact, but the best information available.
Sales per Rep
TTM revenue ÷ Marketing & Sales employees
Performing this simple calculation for a stock and its competitors facilitates comparison. Whose sales organization appears to be the most effective?
Again, other factors beyond the ability of the marketing and sales employees could account for differences in Sales per Rep amounts between competitors.


