How do you analyze profit margins? Video summary
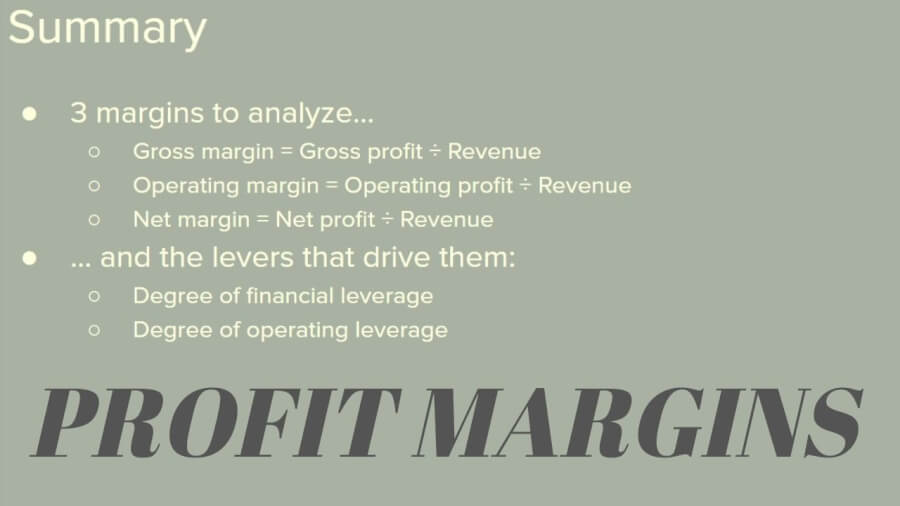
There are three primary profit margins to analyze when researching stocks:
- Gross margin
- Gross profit ÷ revenue
- Operating margin
- Operating profit ÷ revenue
- Net margin
- Net profit ÷ revenue
It’s also important to analyze the levers that drive margins. Those are:
- Degree of financial leverage
- Degree of operating leverage
Philip Fisher’s points 5 & 6
These points are from Fisher’s book Common Stocks and Uncommon Profits. They’re are the inspiration for this video and post.
Point 5, essentially, asks if the company you’re analyzing has worthwhile profit margins. The focus here is on the present.
Point 6 asks what actions the company is taking to maintain or improve those profit margins. The focus here is on the future.
How do you calculate gross margin?
Gross margin = gross profit ÷ revenue
Gross profit, if you’re not familiar, is revenue minus the cost of goods sold (COGS). COGS is also, sometimes, referred to as cost of revenue (COR).
Gross margin is the percentage of revenue that was carried to gross profit.
Do not confuse gross margin with markup. Markup is gross profit ÷ COGS.
COGS includes costs that are more directly associated with the earning of revenue. The costs are incurred to prepare products and services for delivery to the customer.
If a company has inventory, these costs are added to that first (on the balance sheet) and then moved to the income statement when the products are sold.
Where applicable, COGS includes the cost of materials, labor, and overhead.
Tesla COR/COGS example
What costs might a car manufacturer like Tesla include in COR?
Materials like steel, plastic, and batteries.
Labor and machine costs like receiving, assembly, and quality control.
Overhead costs like depreciation, indirect labor (supervisors), utilities, and insurance.
How do you calculate the operating margin percentage?
Operating margin = operating profit ÷ revenue
Operating profit is gross profit minus selling, general, and administrative (SG&A) expenses. Research and development (R&D) is an SG&A expense.
Operating margin is the percentage of revenue carried to operating profit.
SG&A expenses are not inventoried like COGS. SG&A expenses include things like sales, marketing accounting, R&D, and executive salaries.
SG&A expenses are not (usually) directly tied to specific products and services. There are exceptions however. Sales, shipping, and R&D being the most obvious among them.
SG&A costs are expensed (charged against revenue when they’re incurred) vs capitalized (placed into inventory and charged against inventory when it’s sold – COGS).
What does net margin mean?
Net margin = net profit ÷ revenue
Net profit is equal to operating profit minus interest, taxes, and any other income or expenses that are incurred.
Keep in mind that interest (along with other income) can be earned by a company too. In which case it would be added to operating profit. Interest paid is part of the cost of borrowing. Interest earned is (typically) from cash and investments (usually short-term highly-liquid) held by the company.
What is degree of financial leverage?
Degree of financial leverage = operating profit ÷ (operating profit – interest expense)
See my sister site (and YouTube channel) Spreadsheets for Business for a more in-depth explanation.
A company’s degree of financial leverage (DFL) is expressed as a ratio/multiplier. For example, if a company has a DFL of 4.2, that would mean a 10% change in operating profit will result in a 42% (4.2 × 10%) change in net profit. This assumes that all other things are equal, of course.
The opposite is also true. If the example company had a 10% decrease in operating profit, net profit would decrease by 42% (4.2 × -10%)!
If borrowed money (debt) can be used effectively by a company, then net profit can explode! If it can’t, then the opposite effect will be felt.
What is the degree of operating leverage formula?
Degree of operating leverage = change in operating profit ÷ change in revenue
It can also be calculated as follows:
Degree of operating leverage = total contribution margin ÷ operating profit (EBIT)
The second formula is more up-to-date and accurate (in my opinion). But, it requires that you know a company’s fixed and variable cost mix. That’s going to be almost impossible to know if you’re not an accountant at the company. So, the first formula is typically used in stock analysis.
Spreadsheets for Business also has an in-depth post on the degree of operating leverage (DOL).
The DOL is also expressed as a ratio/multiplier. For example, if a company has a DOL of 4.2, that would mean a 10% change in revenue will result in a 42% (4.2 × 10%) change in operating profit. This assumes that all other things are equal, of course.
The opposite is also true. If the example company had a 10% decrease in revenue, operating profit would decrease by 42% (4.2 × -10%)!
If fixed costs (COGS and SG&A) can be used effectively by a company, then operating profit can explode! If it can’t, then the opposite will happen.
Wrapping up analyzing profit margins
A profit margin analysis is an analysis of operational and financial business decisions.
“Good” and “bad” profit margins are relative terms. It depends on the company’s business model, industry, the competition, and other benchmarks.
Improving margins is almost always good. It reduces risk from high fixed costs and interest expense. It also inspires confidence in the management’s investing acumen.


